
How to Use Schema Explorer
Last updated
Schema Explorer lists every metric and dimension available in each Power My Analytics connector. Use it to find the fields you need, see which fields can be used together in one Data Studio chart, and check whether a field is live, unique, daily, or lifetime.
What Is a Mix-And-Match Error in Data Studio?
Each connector contains two or more tables which contain partial sets of all the available fields for that connector. This can cause a mix-and-match error.
In Data Studio, only fields that are from the same table can be used together in one chart. Some fields may be available in more than one table, but may not be available in all tables.
Using fields from two or more different tables together in one chart causes a mix-and-match error. Schema Explorer displays the limited set of fields available in each table so you are able to avoid this error.
See Connector Error: Can’t Mix and Match Fields from Different Tables for more help with this issue.
If you are using the Sheets add-on: Mix-and-match errors are not possible, and you do not need to use Schema Explorer to avoid them. You can still use Schema Explorer to browse metrics and dimensions for your connectors.
Explore Connectors and Fields
Open your Power My Analytics Hub. On the left navigation pane under Tools, click Schema Explorer. You can also go straight to Schema Explorer.
Click the Source dropdown and choose the connector you want to explore. You can type in the dropdown's search box to find a connector quickly.
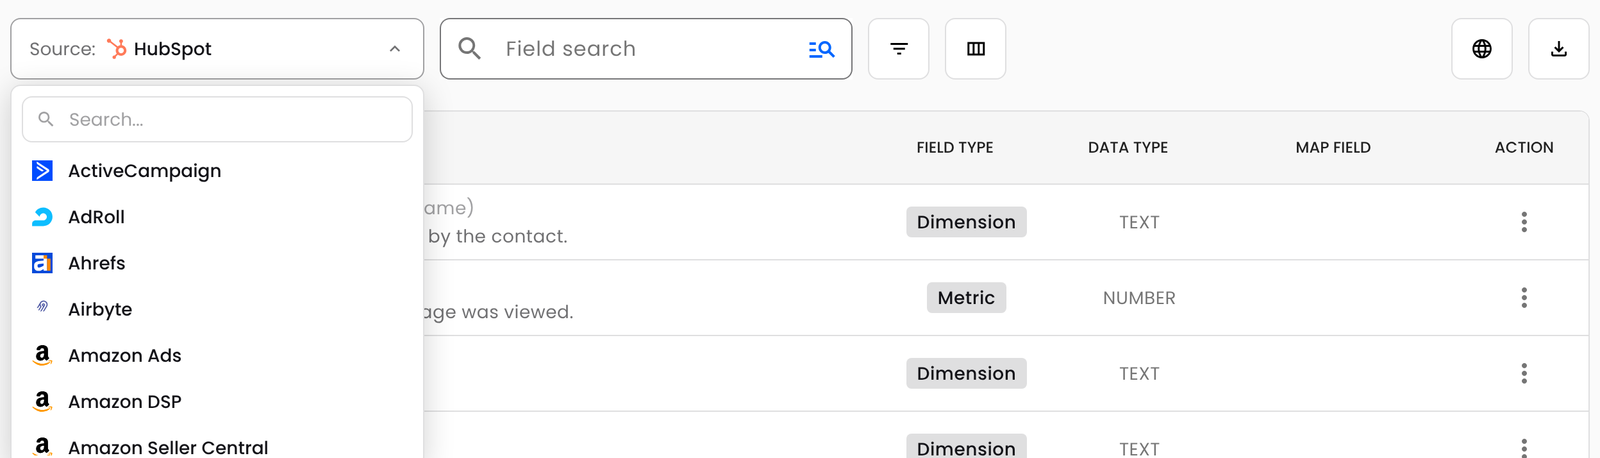
Each field is listed with its label, its description, its field type (Metric or Dimension), and its data type. Click any field to open Field Details, which also lists the tables the field belongs to.
If the connector's fields are available in more than one language, click the globe icon to choose a language. To save the list you're looking at, click the download icon and choose CSV or PDF.
Search and Filter Fields
Type a keyword in Field search to find fields by label, field name, or description. To search names only, click the icon at the right end of the search box; click it again to include descriptions. You can also hover over a field label to see its field name.
To narrow the list, click the Filter button next to Field search. The Filter by menu has four categories, and each option shows how many fields match it:
- Field Type: Metric and Dimension. Both are checked to start; uncheck one to see only the other.
- Data Type: The kinds of values the fields hold, such as TEXT, NUMBER, PERCENT, or CURRENCY. All are checked to start.
- Table: The connector's tables and how many fields each one has. No tables are checked to start, so you see fields from every table; check a table to see only its fields.
- Other: Popular, Common, PII, Live, Unique, Daily, and Lifetime. Nothing is checked to start; check an option to see only the fields that have it. If you check more than one, you see the fields that have any of them.
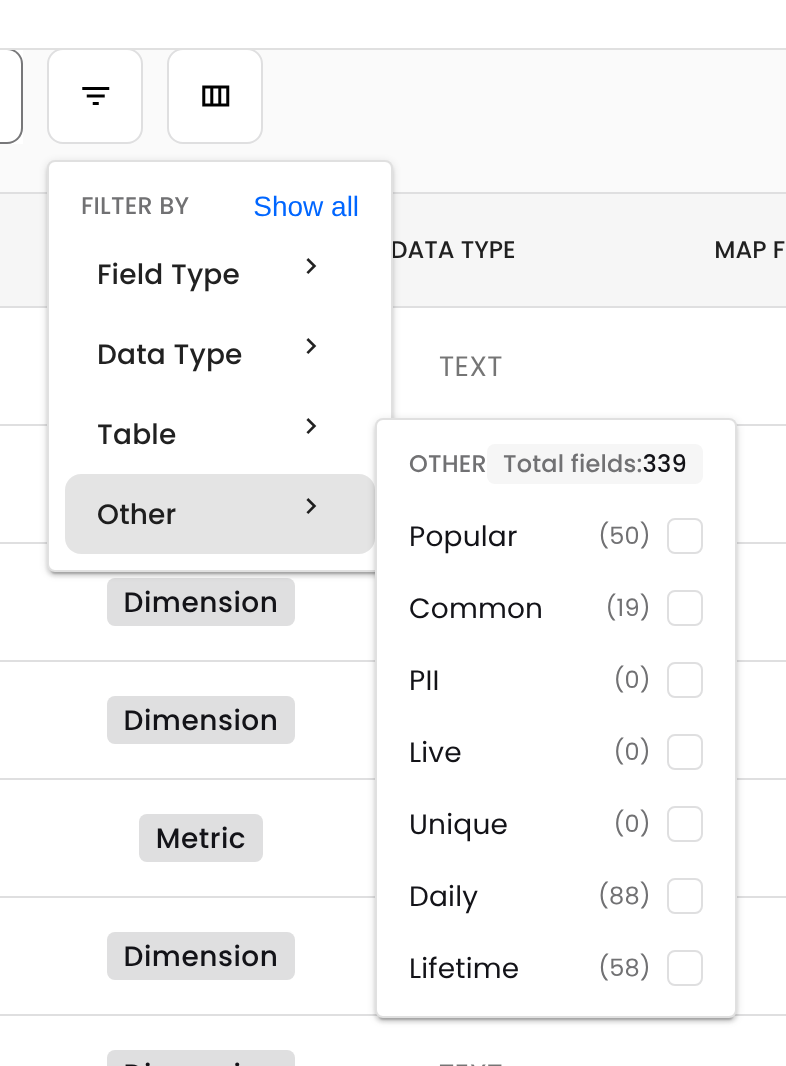
Filters in different categories work together, and the count below the field list shows how many fields match. To start over, click Show all at the top of the Filter by menu.
Note: Looking for the Metric Type filter? Live and Lifetime are now options under Other, along with Daily and Unique.
What Live, Unique, Daily, and Lifetime Mean
| Option | What it means |
|---|---|
| Live | Power My Analytics requests the field from the platform in real time each time your report runs, instead of using cached data. Live fields also show a lightning bolt icon next to their name. |
| Unique | The metric's values can't be added together across days or rows. Facebook Ads Reach is one example: a person reached on several days is counted once. |
| Daily | The metric is reported for each day, so you can see how it changes over your date range. |
| Lifetime | The metric is an all-time value (for example, a follower count) rather than a value for each day. Lifetime metrics can't be backfilled: Power My Analytics starts collecting them on the day you connect your source. |
Unique, Daily, and Lifetime describe metrics, so checking only those options under Other hides dimensions. A metric can be both Daily and Lifetime when it's available in a daily table and in a lifetime table.
To learn how live fields affect your reports, see Understanding Cached and Live Data Requests.
Show Live, Unique, Daily, and Lifetime Columns
You can add a column for each of these options to the field list:
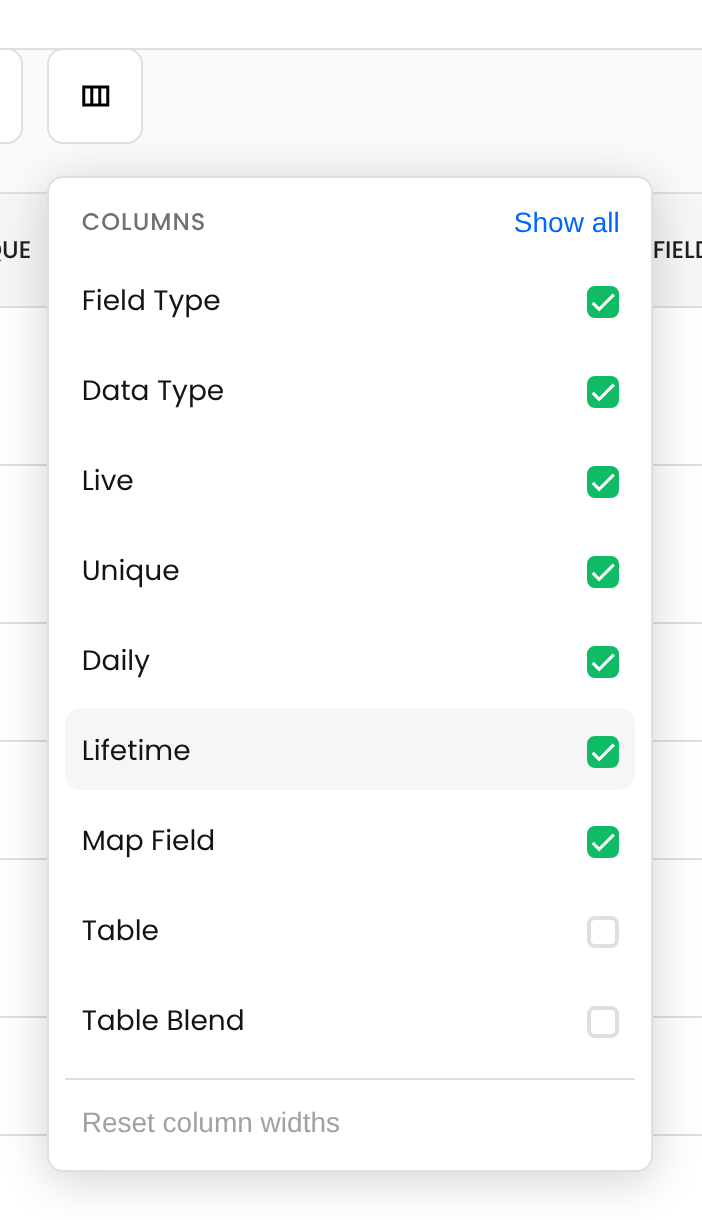
Click the Columns button (to the right of the Filter button).
Check Live, Unique, Daily, or Lifetime.
A check mark in a column means the field has that attribute.
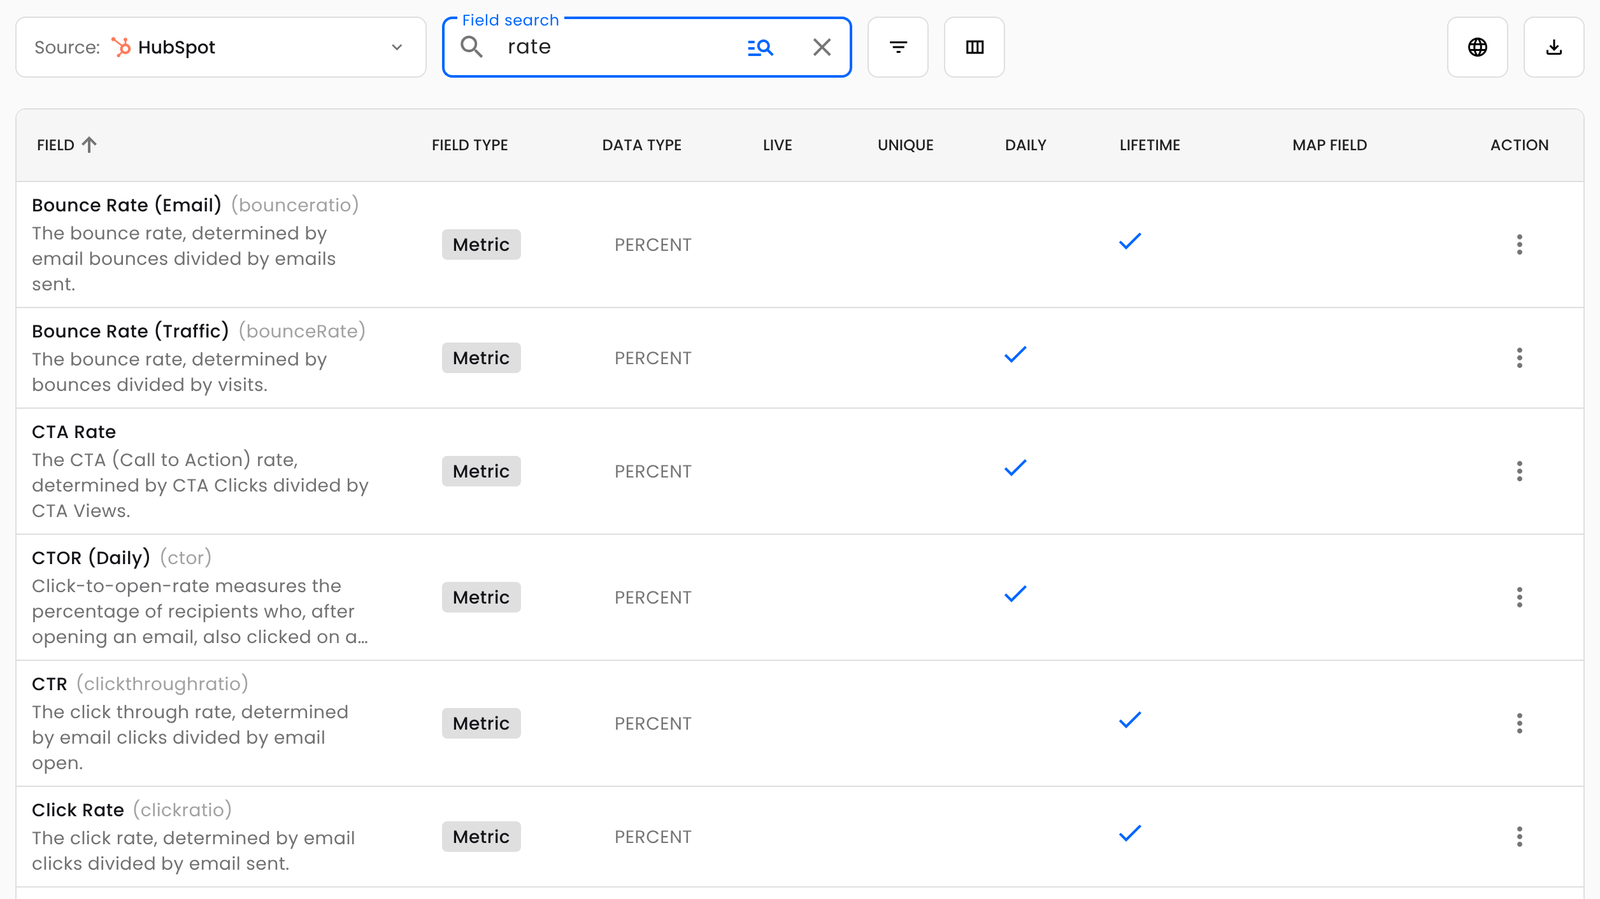
These columns are hidden until you turn them on. The same menu also shows or hides the Table column and other optional columns, and Schema Explorer remembers your column choices for each connector in your browser.
Find Fields You Can Use Together
Fields can be used together in one Data Studio chart when they share at least one table. To find a set of fields that work together:
Click the Filter button, then Table.
Check the table you want to report from.
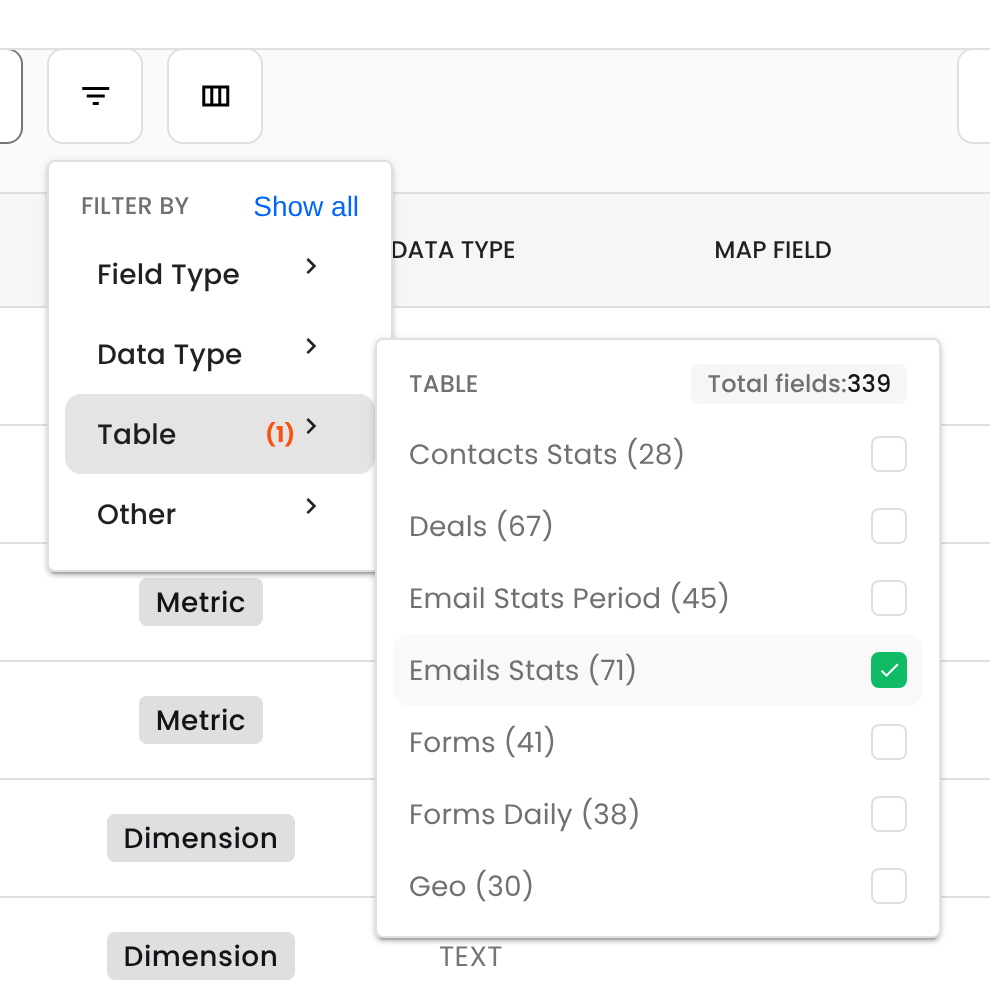
The list now shows only the fields in that table. You can use any of them together in one chart.
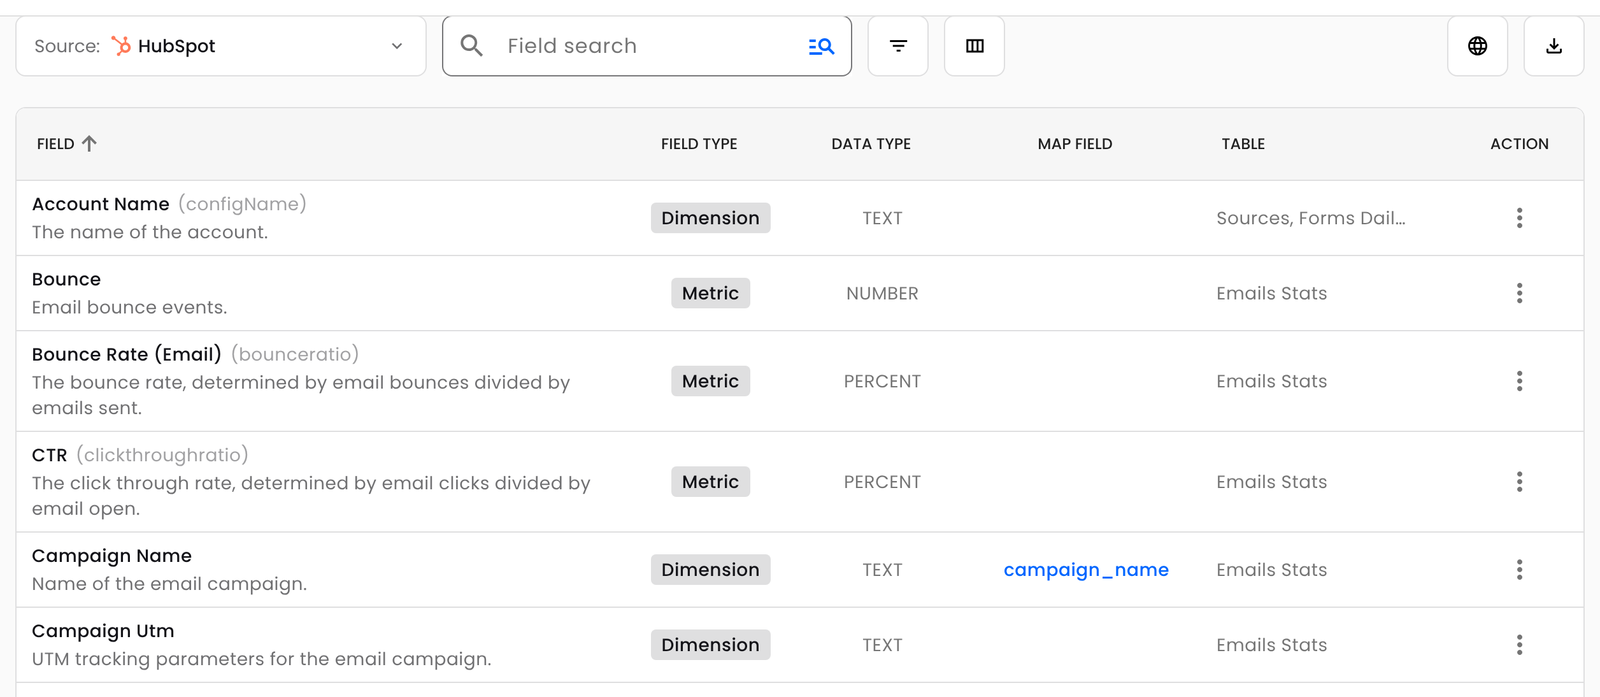
To see every table a field belongs to, turn on the Table column from the Columns button, or click the field to open Field Details.