
Google Sheets Data Integration Guide
Last updated
Use the Power My Analytics add-on to bring your marketing data into Google Sheets, build reports from any connected source, and keep them up to date automatically. This guide covers installing the add-on, creating and editing reports, refreshing data, and scheduling refreshes.
Note: This guide covers the current Google Sheets sidebar. The video shows the earlier sidebar, which the Microsoft Excel add-in still uses; for Excel, see the Microsoft Excel Data Integration Guide.
Install the Google Sheets Add-on
Open a new Google Sheets spreadsheet.
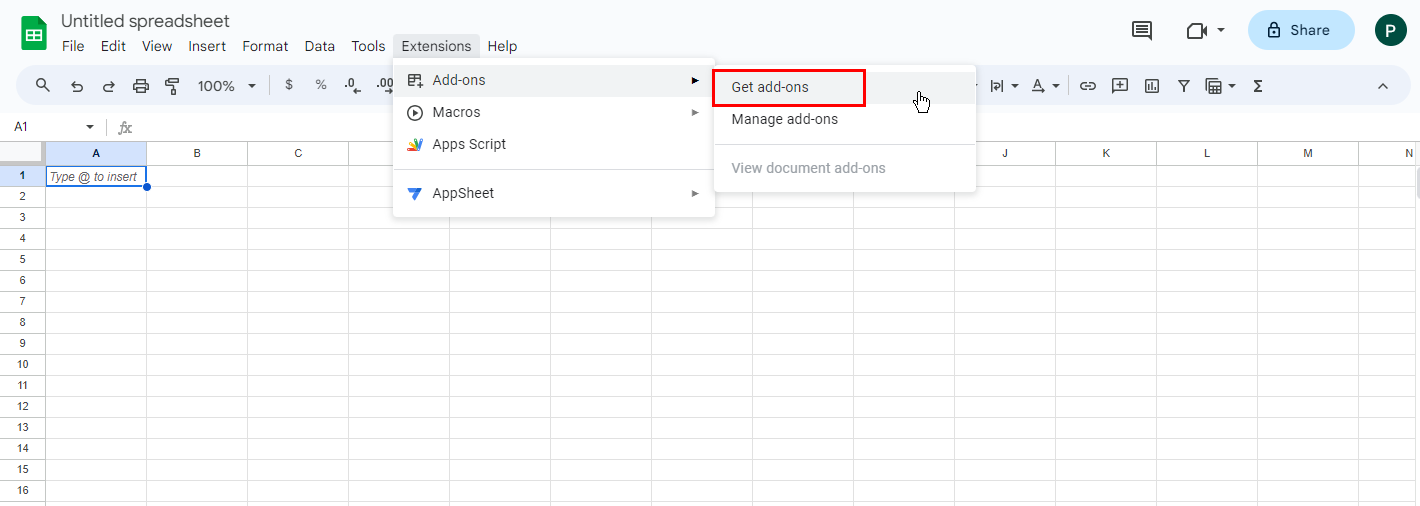
Go to Extensions > Add-ons > Get add-ons.
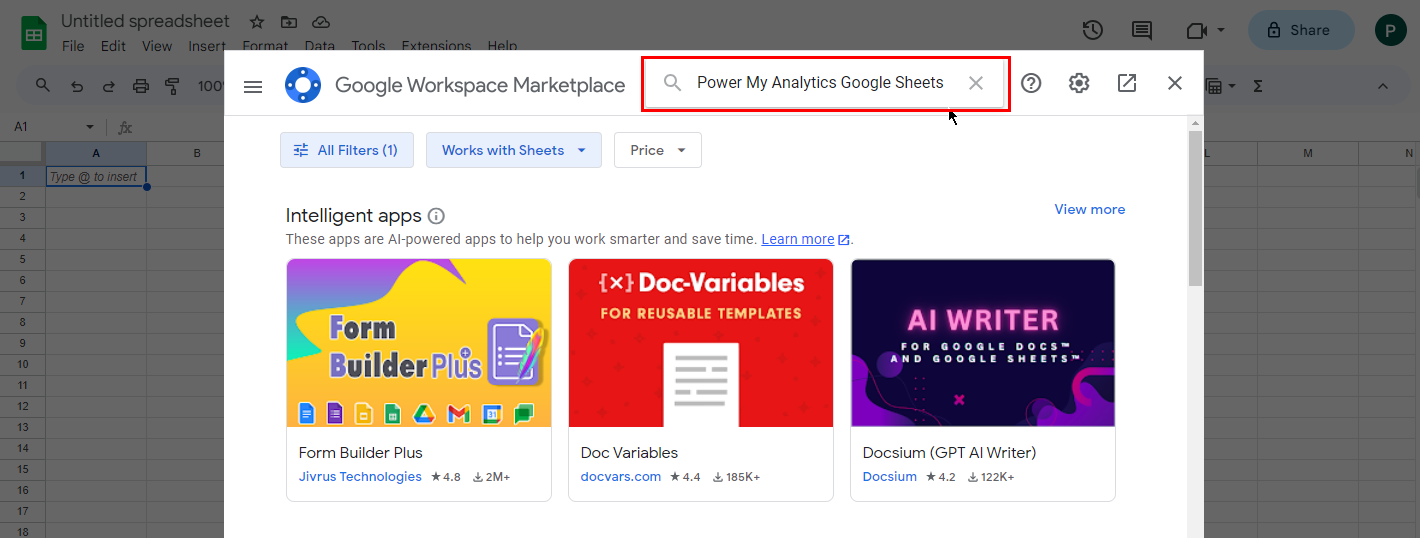
Search for "Power My Analytics" in the Google Workspace Marketplace.
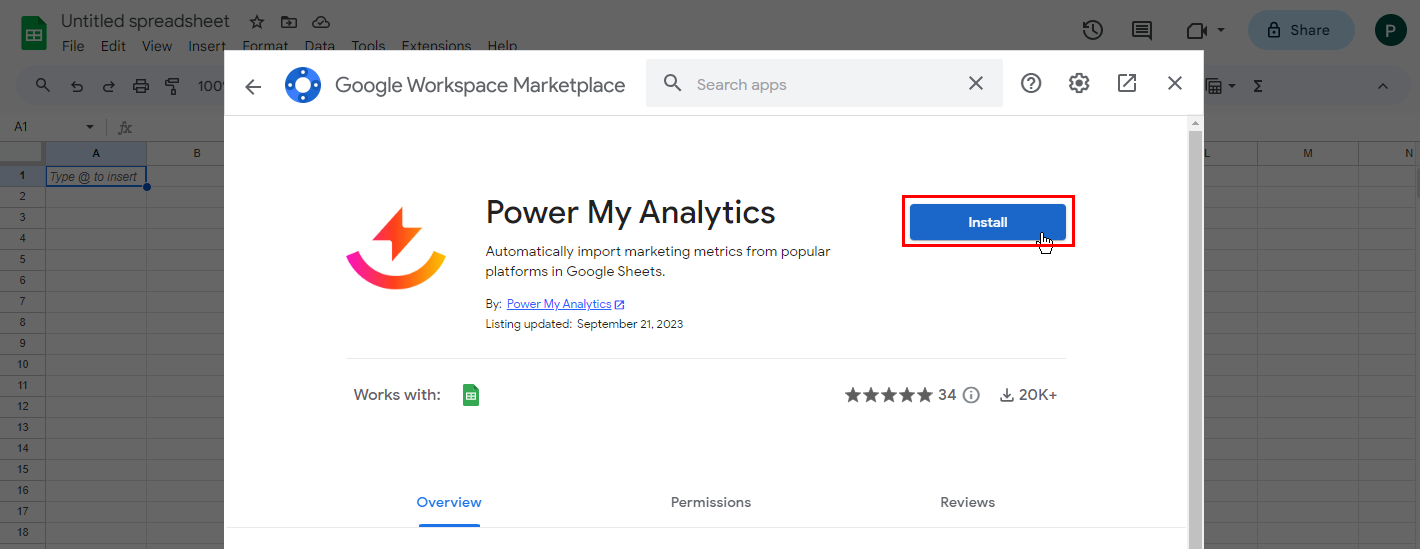
Click Install on the Power My Analytics Sheets Data Connector.
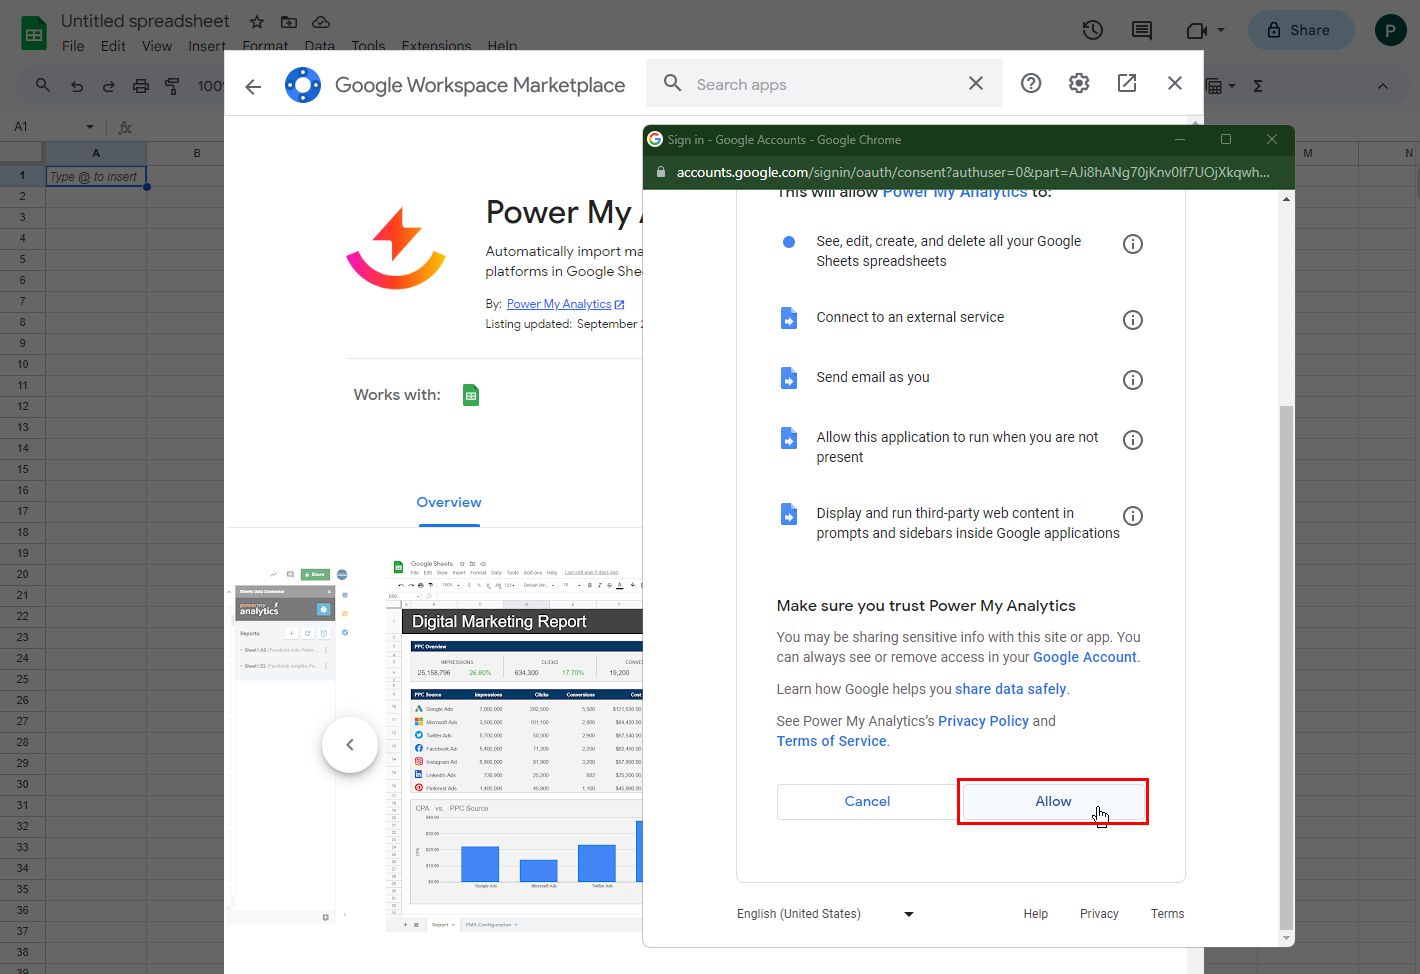
Authorize the add-on when prompted.
Go to Extensions > Power My Analytics > Open sidebar and click Sign in. Your Hub opens in a new tab: sign in there, or sign up if you're new to Power My Analytics. The add-on has no separate login; it uses your Hub sign-in.
Return to your spreadsheet. The sidebar opens on its own once you're signed in, with no page reload needed.
For screenshots of each sign-in step, see Installing the Power My Analytics Add-on for Google Sheets.
Find Your Way Around the Sidebar
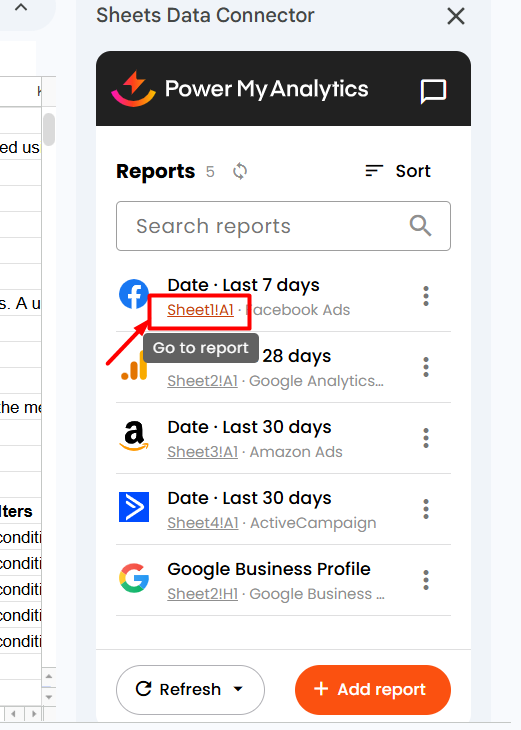
The sidebar lists every report in the spreadsheet under Reports, with the number of reports beside the heading.
- Search reports: type part of a report's name, its location (such as
Sheet1!A1), or its connector to filter the list. - Sort: sort the list by Name, Sheet, or Connector. This appears when the spreadsheet has two or more reports.
- Update report list: the circular arrows beside the Reports heading reload the list, for example after you edit the PMA Configuration tab.
- Go to report: click a report's location (such as
Sheet1!A1) to jump to its sheet and select the report's data. - Report actions: the three-dot menu on each report has Summary, Refresh, Edit, Duplicate, Move, and Delete.
- Refresh and Add report: the two buttons at the bottom of the sidebar.
- Request support: the chat bubble icon at the top of the sidebar.
Create a New Report
- In your spreadsheet, select the cell where the report should start (for example,
A1on an empty sheet). - Click Add report at the bottom of the sidebar.
- Work through the steps, one page at a time. The top of the sidebar shows where you are (for example, Step 3 of 7). Click Next to continue, or Back to return to the previous step.
- Source: choose the connector you want to report on, such as Facebook Ads or Google Analytics 4.
- User: choose the Hub and the connected user (the login your Hub uses for that source). If the user you need isn't listed, click Connect user to connect it in your Hub, then come back and click Refresh. To try the add-on without your own data, click Use sample data.
- Configure: choose the account and any other settings the connector needs, such as an ad account or a property. Only accounts that are active in your Hub are listed.
- Date Range: choose a preset range or Custom. For ranges such as "Last 30 days," type the number and the dates update as you type. Turn on Include today to add today's data.
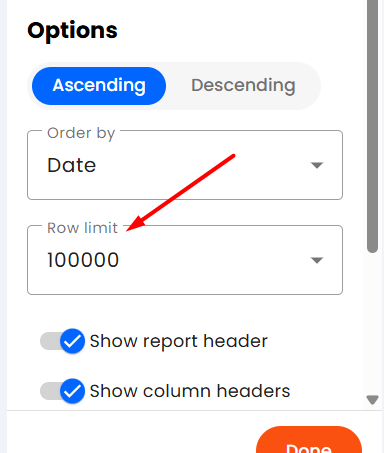
- Fields: choose your dimensions and metrics. Use the All, Metrics, and Dimensions tabs, or search by name; each result shows a short description of the field. Drag your selected fields to change their column order.
- Filters (optional): include or exclude rows. See Filter Your Report Data below.
- Options: choose the sort order, the row limit, and how the report looks. See Report Options below.
- On the last step, check the Report name (the add-on suggests one, such as "Date · Last 30 days") and the Report location. To place the report somewhere else, select a different cell in your spreadsheet, then click the Use selected cell button in the Report location field.
- Click Create report. If the button is unavailable, the line just above it tells you what's missing, such as "Choose at least one field."
The report loads at the location you chose. The first time you create a report, the add-on also adds a PMA Configuration tab that lists every report in the spreadsheet and its settings.
If a user is marked Disconnected or Missing permissions, or an account you need isn't listed, see Fix a Disconnected User or a Missing Account.
Note: As you pick fields, the add-on hides any field that can't be combined with the fields you've already chosen, so your report never mixes incompatible data (the field conflicts that can happen in other reporting tools, such as Data Studio). If you can't find a field, remove one of your selected fields to see whether it becomes available.
Report Options
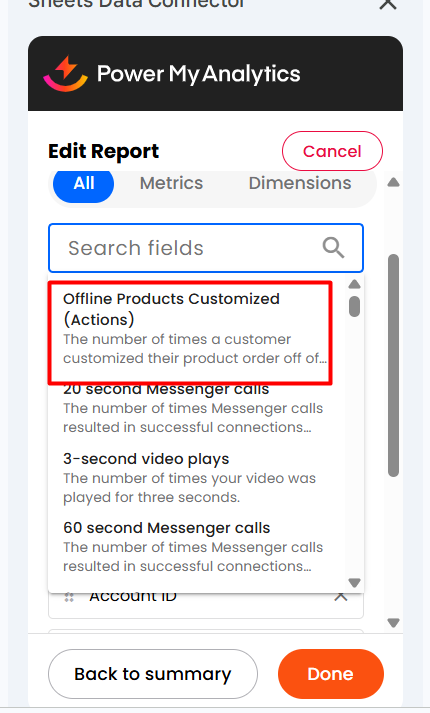
On the Options step, choose Ascending or Descending, the Order by field, and the Row limit, then turn these display options on or off:
- Row limit: the most rows the report loads. New reports load up to 100,000 rows by default, and you can choose up to 1,000,000. If a report stops short of the end of its date range, raise its row limit.
- Show report header: adds a header row with the report's date range. Turn this off if you plan to connect the sheet to Data Studio.
- Show column headers: adds a row with each field's name.
- Show all time values: fills in dates that have no data. This works only when Date is the report's only dimension.
- Show 'No data': shows "No data" when there is no data for the report.
- Show report grid lines: adds borders around the report's cells.
- Use readable dates: shows months, weeks, and weekdays as text, such as "2021 Week 28" instead of "202128".
Filter Your Report Data
Filters decide which rows your report includes. A report with no filters includes all rows.
- On the Filters step, click Add filter.
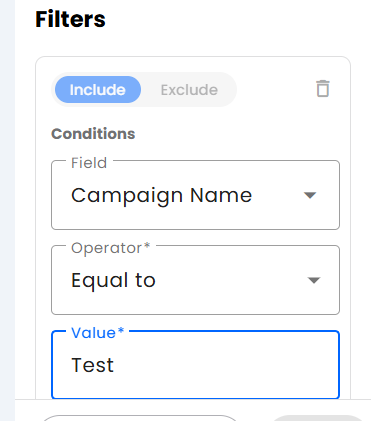
- Choose Include to keep the rows that match, or Exclude to leave them out.
- Under Conditions, choose a Field, an Operator, and a Value, then click Save condition.
- To narrow the filter, click Add condition. A row must match every condition in a filter.
- To add another filter, click Add filter again.
How filters work together:
- All of the conditions in one filter must match.
- If you add more than one Include filter, a row is kept when it matches any of them. If you add more than one Exclude filter, a row is left out when it matches any of them.
- Include and exclude filters apply together: a row must match an include filter and must not match any exclude filter.
- Each filter uses either dimensions or metrics, not both. To filter on a dimension and a metric, add a separate filter for each.
The operators you can choose depend on the field:
| Field type | Operators |
|---|---|
| Text | Equal to, Starts with, Contains, Is whitespace (blank), Is N/A (no value), Regex (case-insensitive), Regex (case-sensitive), In comma-separated list |
| Number, currency, percent, or duration | Equal to (=), Greater than (>), Greater than or equal to (>=), Less than (<), Less than or equal to (<=) |
| Date | The number operators, plus Is N/A (no value) |
| True or false | Equal to (=) |
Is whitespace (blank) and Is N/A (no value) don't need a value.
Fix a Disconnected User or a Missing Account
Reconnect a Disconnected User
On the User step, a user that needs attention is marked Disconnected or Missing permissions. When you select it, the step says so (for example, "This user is disconnected.") with a Reconnect link.
- Click Reconnect. Your Hub opens in a new tab and starts the platform's sign-in right away.
- Sign in with the login you use for that platform, approve the permissions it asks for, and choose which accounts to activate.
- Close the Hub tab, return to your spreadsheet, and click Refresh under the User field. The user is listed as connected again.
The same Reconnect link appears on a report in the report list when a refresh fails because its data source was disconnected.
Activate a Missing Account
On the Configure step, the account list shows only the accounts that are active in your Hub.
- Click Activate accounts under the account field. Your Hub's Sources page opens in a new tab, showing that source's accounts.
- Activate the accounts you want to report on.
- Return to your spreadsheet and click the refresh icon on the account field. The accounts you activated are added to the list.
Note: Active accounts count toward your plan's account limits. If an account you activated still doesn't appear after you refresh the list, submit a ticket.
Edit a Report
- Open the report's three-dot menu and select Edit.
- The editor opens a summary of the report: its Report name and one row for each step with its current setting. Click a row to open that step.
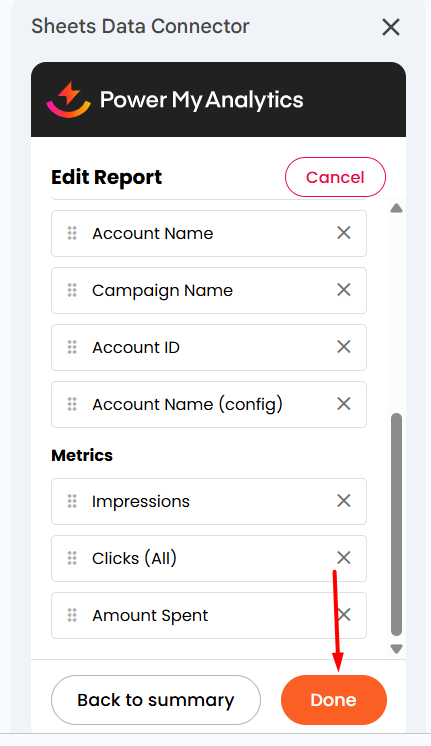
- Make your changes, then click Done to keep them and return to the summary. Back to summary returns without keeping that step's changes.
- Click Update report to save the report.
Note: Changing a report's Source clears its user, settings, fields, and filters, so you'll choose them again.
To look at a report's settings without opening the editor, select Summary in its three-dot menu.
Duplicate, Move, or Delete a Report
Open the report's three-dot menu, then:
- Duplicate creates a copy of the report.
- Move moves the report to another location in the spreadsheet.
- Delete removes the report from the add-on, so it no longer refreshes.
These actions are unavailable while a refresh is running. Wait for the refresh to finish, then try again.
Refresh Your Report Data
From the Sidebar
- To refresh every report, click Refresh at the bottom of the sidebar and select Refresh all reports.
- To refresh one report, open its three-dot menu and select Refresh.
While reports refresh, each report shows its progress on its logo, and the bottom of the sidebar counts the reports as they finish (for example, "4 of 11 done"). When the refresh ends, you'll see a summary; click the close icon (Dismiss refresh status) to clear it. You can keep working in the sidebar while a refresh runs.
If a report fails, its row shows the error. Later, an error icon beside the report's name shows the last error when you hover over it. If the data source was disconnected, the report shows a Reconnect link; reconnect the user (see Reconnect a Disconnected User), then refresh the report.
Note: Google stops add-on refreshes after 6 minutes. If a large refresh is cut off, the sidebar tells you, and you can click Refresh the rest to finish the reports that didn't refresh.
From the Extensions Menu
You can refresh without opening the sidebar. Go to Extensions > Power My Analytics and select Refresh all reports, or Refresh reports on this sheet to refresh only the reports on the sheet you're viewing. A message at the bottom of the spreadsheet shows the progress. If any report fails, a pop-up lists each one with its error.
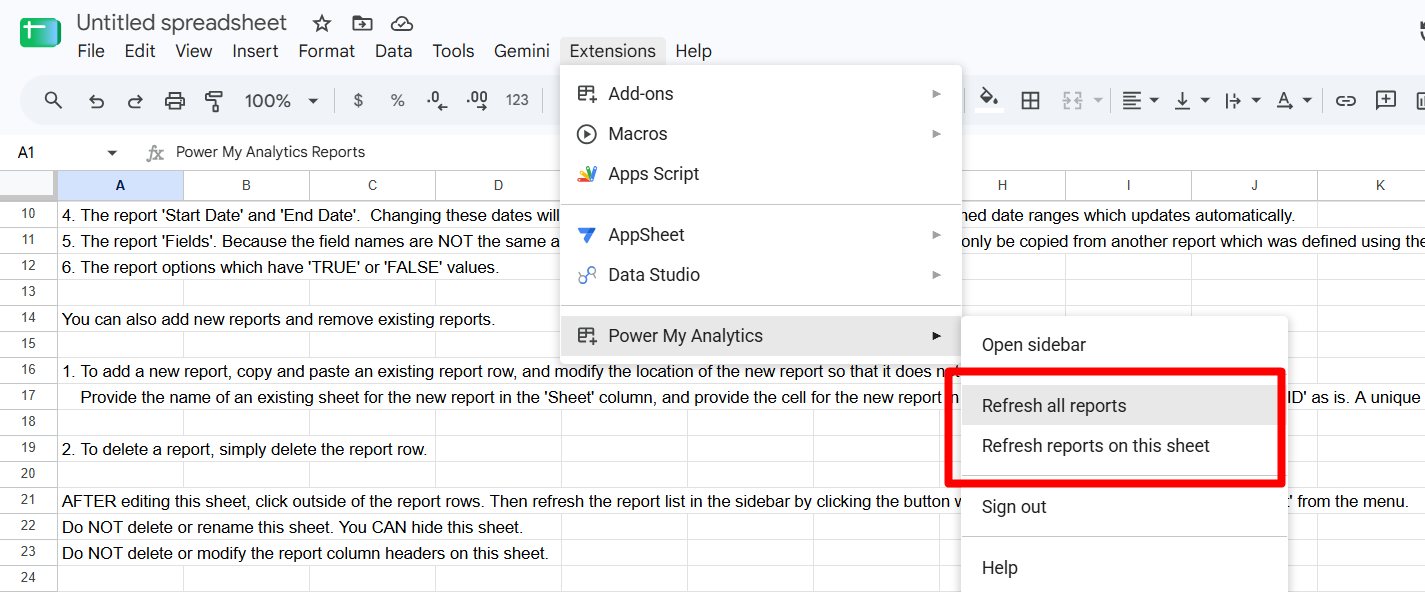
Note: These menu items appear once you're signed in to the add-on.
Schedule Automatic Refreshes
A schedule refreshes every report in the spreadsheet automatically. Each spreadsheet has one schedule.
Before you start, make sure the spreadsheet has a time zone (File > Settings > General > Time zone). The schedule runs in that time zone.
- Click Refresh at the bottom of the sidebar and select Schedule refresh.
- Choose a Frequency: Monthly, Weekly, Daily, or Hourly. For a monthly or weekly schedule, also choose the Day.
- Choose a Time. The hint under the field shows your spreadsheet's time zone. Schedule the refresh at least 2 hours after your data source's sync time, so the latest data is ready (see Configure Data Source Sync Time and Google Sheets Refresh for the Latest Data).
- Optionally, turn on Email reports after each refresh or Email an alert if a refresh fails (see below).
- Check the summary at the bottom of the page (for example, "Refreshes daily at 7 AM."), then click Save.
To stop scheduled refreshes, set Frequency to Off and click Save.
Note: Hourly requires the Hourly Refreshes add-on, or a Custom plan agreement that includes hourly refreshes. Without it, the option shows as Hourly (upgrade required). On an hourly schedule, reports with a Custom date range or a range with "yesterday" in its name refresh twice a day instead of every hour.
Email Your Reports After Each Refresh
Turn on Email reports after each refresh, then set:
- Send reports to: one or more email addresses, separated by commas.
- Sheets to attach: All sheets, or one sheet.
- File type: PDF, CSV, or Excel (XLSX).
- File name: the attachment's name when you attach one sheet. Leave it blank to name the file after the spreadsheet and the sheet. When you attach several sheets, each file is named after the spreadsheet and its sheet, such as "Monthly Report - Facebook Ads".
- Include spreadsheet link, and for PDFs, Portrait orientation and Fit to page width.
- Show advanced settings: set the email's Subject, Body, HTML body, Sender name, Reply-to email, CC, and BCC.
- Send a test after saving: refreshes all reports right away and sends the email, so you can check it.
Note: Report emails and failure alerts are sent from the Google account that saved the schedule. Report emails show the sender name "Power My Analytics" and send replies to noreply@powermyanalytics.com, unless you change Sender name or Reply-to email under Show advanced settings.
Get an Alert When a Refresh Fails
Turn on Email an alert if a refresh fails to get an email whenever a scheduled refresh has an error. If you also email your reports, choose Same as reports to alert the same people, or Other people to enter different addresses under Send alerts to.
Note: Scheduled refresh is available in Google Sheets only. Microsoft Excel reports are refreshed by hand.
Get Help from Our Support Team
Click the chat bubble icon (Request support) at the top of the sidebar to open a support request in a new browser tab, or submit a ticket at any time. Include the report's name and any error text so we can help you quickly.
Related Articles
- Installing the Power My Analytics Add-on for Google Sheets
- Configure Data Source Sync Time and Google Sheets Refresh for the Latest Data
- Google Sheets Scheduled Refresh Not Running
- Missing Data in Google Sheets Report
- Troubleshooting Google Sheets
- How to Connect a Google Sheets Report to Data Studio