
Amazon Seller Data Connector User Guide
Last updated
Note: Amazon Seller Central is a powerful platform for managing your e-commerce business on Amazon. This guide will help you connect your Amazon Seller Central account to Power My Analytics, enabling you to automate data collection and create insightful reports. By integrating Amazon Seller Central with PMA, you'll save time on manual data gathering and gain valuable insights to optimize your Amazon selling strategy.
Prerequisites
Before connecting Amazon Seller Central to Power My Analytics:
- You must either be an Amazon account administrator, or have an Amazon account administrator grant you access to the account with the necessary permissions
Please see How to Connect to Amazon Seller for details on the required permissions.
Adding Amazon Seller Central as a Data Source
Log in to your Power My Analytics Hub
Navigate to Sources in the main menu
Click + Add New Source
Select Amazon Seller Central from the gallery
Choose your main Marketplace
Assign a memorable name to the account (include the region if applicable)
Indicate your fulfillment method in Using FBA:
- Select Yes for Fulfillment by Amazon (FBA)
- Select No for Merchant fulfilled
Click Connect to authenticate your account
Approve the required permissions in the consent pop-up
Creating a Data Studio Report
Follow these steps to create a Data Studio report using your Amazon Seller Central data:
After adding Amazon Seller Central as a data source, go to Reports > Data Studio
Select Amazon Seller Central under Create Data Studio Report (this will open the official Data Studio application in a new window)
Google Data Studio Configuration:
Step 1:
- Name your data source (e.g., "Amazon Seller Central - [Organization Name]")
- Choose your Power My Analytics hub from the dropdown
- Optional: Leave "Use report template for new reports" checked for the PMA demo template
- Click Next
Step 2:
- User Account: Select your Amazon Seller Central account (for real data) or "Sample Account" (for sample data)
- Click Next
Step 3:
- Choose "Currency" for reports
- Optional: Choose “Optional - Order Status Filter”
- Optional: Allow “Optional - Order Status Filter” modification in reports
- Click Connect (top right) to complete the configuration
Step 4:
- Click Create Report (top right)
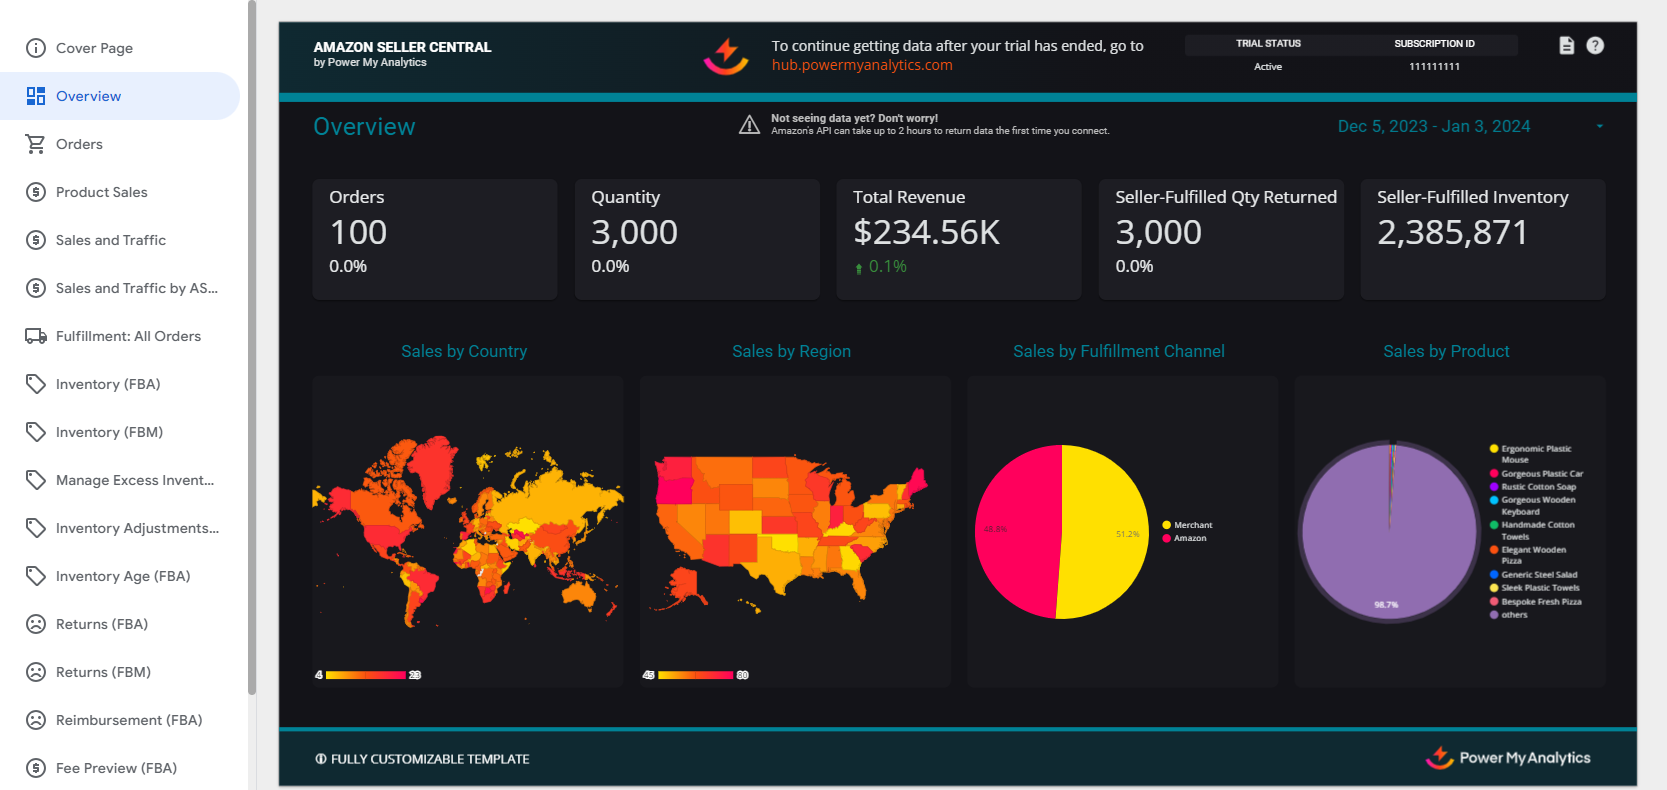
For a quick start, you can use our pre-built Amazon Seller Central demo template.
Key Reports and Fields
Popular metrics available in Amazon Seller Central reports include:
- Orders Metrics: Quantity, Product Revenue, Total Revenue, Order Subtotal, Shipping, Tax, Fees, Order Total
- Product Sales Metrics: Qty Sold, Revenue, Listing & Selling Fees
- Sales and Traffic Metrics: Ordered Product Sales, Units Ordered, Total Order Items, Average Sales per Order item, Average Units per Order item, Average Selling Price, Sessions - Total, Order Item Session Percentage, Average Offer Count, Featured Offer (Buy Box) Percentage
- Note: Featured Offer (Buy Box) Percentage is available in both the Sales and Traffic table and the Sales and Traffic by Child ASIN table; Average Selling Price, Average Sales per Order Item, and Average Units per Order Item are in the Sales and Traffic table only. Power My Analytics caches both tables daily, so either one is a better choice than the live Sales and Traffic by ASIN report, which Amazon rate-limits.
- Fulfillment Metrics: Quantity, Item Price
- Inventory (FBA) Metrics: Fulfillable Qty, Total Supply Qty, Inbound Shipped Qty, Reserved Qty, Unsellable Qty, Total Qty, Days Of Supply, Estimated Excess
- Inventory (FBM) Metrics: Pending Inventory, Total Inventory
- Manage Excess Inventory (FBA) Metrics: Your Price, Estimated Excess, Units Shipped Last 30 Days, Days Of Supply, Est. long-term storage units, Est. Long-term storage fee
- Inventory Adjustments (FBA) Metrics: Carrier Damaged, Customer Damaged, Distributor Damaged, Fulfiller Damaged, Warehouse Damaged, Unsellable, Unknown, Sellable, Defective
- Inventory Age (FBA) Metrics: 0-90 Days, 91-180 Days, 181-270 Days, 271-365 Days, 365+ Days, Units Shipped Last 30 Days
- Returns (FBA) Metrics: Qty Returned
- Returns (FBM) Metrics: Return Quantity
- Reimbursement (FBA) Metrics: Amount Total, Quantity Reimbursed
- Fee Preview (FBA) Metrics: Selling Price, Est. Referral Fee, Est. Fulfillment Fee, Est. Total Fees, Est. Revenue Minus Fees
- Fees Metrics: Amount
- Negative & Neutral Feedback Metrics: Review Rating
- Settlement Reports: Available for 90 days
For a complete list of available Amazon Seller Central fields, refer to the Schema Explorer.
Limitations and Important Considerations
Cached Data Requests with Unique Metrics and Date Dimension: When a unique metric is paired with the date dimension, this will result in a request for cached data instead of a request for live data. For more information, please see Understanding Cached and Live Data Requests.
Backfilling: When you first connect your Amazon Seller Central account as a data source, Power My Analytics backfills up to 2 years of data for each table, within that table's limit below. After that, only the Orders and Sales and Traffic tables can be backfilled from the Hub; every other table, including Sales and Traffic by Child ASIN, keeps the history loaded when you first connected (the daily Data Sync keeps it current).
Backfilling limitations:
- Sales: 2 years
- Sales and Traffic: 2 years
- Sales and Traffic by Child ASIN: 2 years (loaded when you first connect; not available for Hub backfills)
- Fees: 180 days
- Returns: 2 years
- Seller Reviews: 2 years
- Seller-Fulfilled and FBA Inventory: 1 day
- FBA Unsellable Inventory: 2 years
- Settlement Reports: 90 days
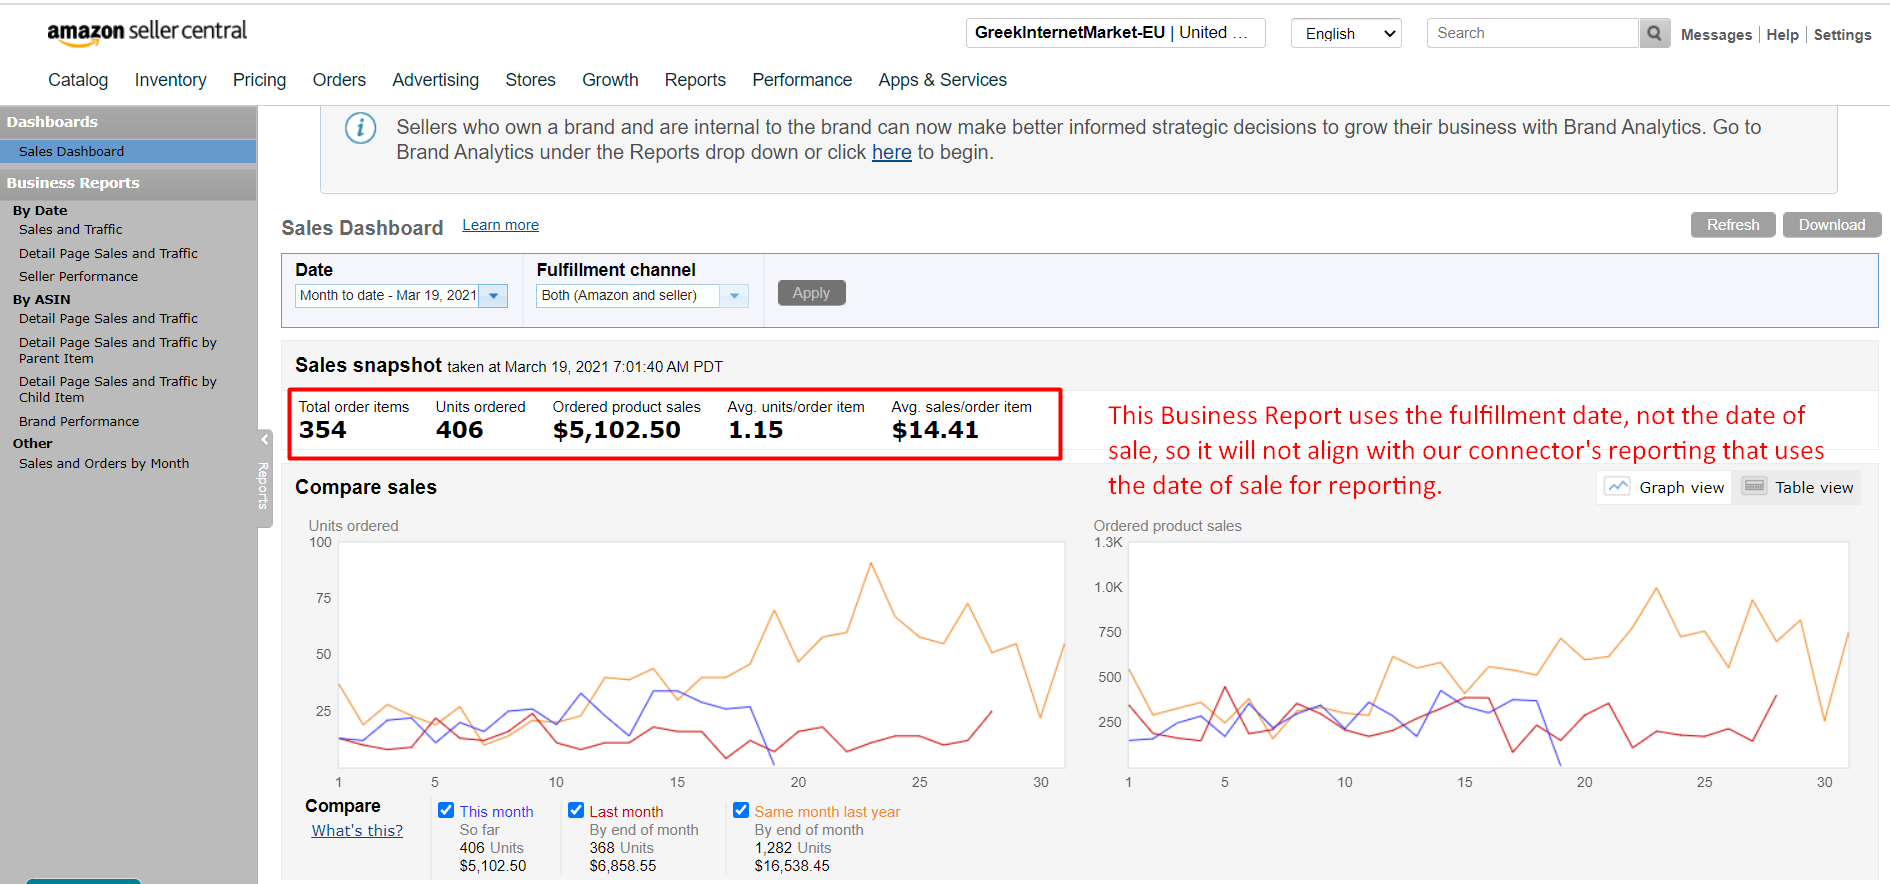
Sales reporting by date shipped: Sales reports are referenced by order date. If you attempt to compare Amazon's business reports to our connector's data, there will be a mismatch due to this key difference in sales reporting date.
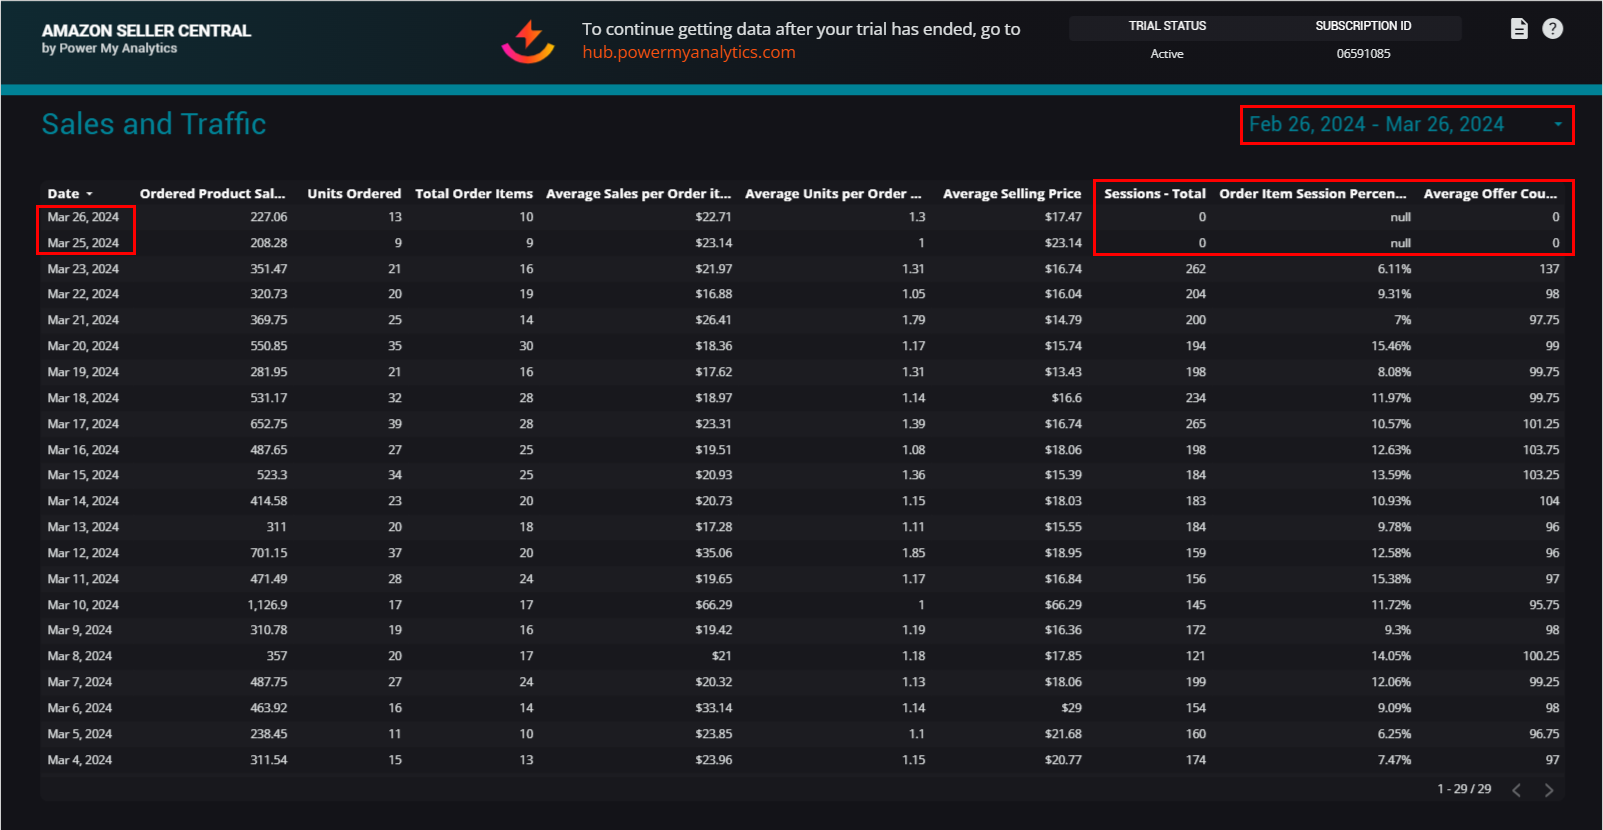
Sales and Traffic data delay: Data for fields in the Sales and Traffic table may be delayed by up to 72 hours, so the most recent days in your report can show zero or empty traffic values until a later Data Sync fills them in. Power My Analytics stores this table daily (it is not a live report), and you can backfill it up to 2 years back.
Data discrepancies: Reported values through the API may differ from Amazon UI values by 1-5%. This difference will be larger for shorter date ranges, and smaller for longer date ranges.
Featured Offer (Buy Box) Percentage over multi-day ranges: For a single day in a report scoped to one marketplace, Featured Offer (Buy Box) Percentage matches Amazon. For a week, a month, or another multi-day range, Power My Analytics calculates it from daily totals, which comes close to Seller Central but may not match it exactly. See A Smaller Gap on Weekly or Monthly Date Ranges.
Fee and Quantity reporting: The Quantity field cannot be used in same table as Fee field, and will produce incorrect fee values
Inventory reporting: All inventory reports are lifetime values and cannot be broken down by date. When reporting inventory by a date range, this will return the total values for the date range.
Sales and Traffic by ASIN report (live): The live Sales and Traffic by ASIN report cannot be dimensioned by date (an Amazon API limitation that also appears in Amazon Seller Central's own UI). For ASIN-level reporting that supports date dimensioning, includes traffic on zero-sales ASINs, and is not subject to Amazon's rate limits, see the Sales and Traffic Reporting by ASIN section below.
FNSKU Reporting in Economics: FNSKU is not available for the Economics Report.
What does this mean for me?
- Expect your totals to sit within 1-5% of Amazon's own reports on long date ranges, and further apart on short ranges such as a single day.
- Keep Quantity and Fee fields in separate tables; combining them produces incorrect fee values.
- Report inventory without a date dimension. A date-dimensioned inventory chart returns zeros or misleading totals.
- If the last few days of Sales and Traffic data show zero sessions or page views, allow up to 72 hours; a later Data Sync fills those days in.
- Each table has its own history limit (for example, Fees go back 180 days). A report dated before that limit is empty because of the backfill limit, not a sync failure.
- If Sessions - Total, Page Views - Total, or other Sales and Traffic fields are empty before the date you connected your account while your Orders data goes back further, backfill those dates from the Hub (see Backfill Connection Data), or submit a ticket and our support team will run the backfill for you.
- Compare Featured Offer (Buy Box) Percentage one day at a time for an exact match with Seller Central; weekly and monthly figures are a close approximation.
Available Regions and Marketplaces
A Seller ID can report one Region (Americas, Europe and India, or Far East) and all Marketplaces (such as United States, Germany, France, Spain, etc.) under each Region. The following Regions and Marketplaces are available:
- North America: Brazil, Canada, Mexico, USA
- Europe: UAE, Germany, Egypt, Spain, France, UK, India, Belgium, Italy, Netherlands, Poland, Saudi Arabia, Sweden, South Africa, Turkey
- Far East: Singapore, Australia, Japan
Scoping Reports to a Single Marketplace
A connected Amazon Seller Central account covers its entire Region, not just one marketplace. If your account is authorized for the United States and Canada, for example, your reports pull data from both marketplaces together unless you scope them to one.
Totals like Units Ordered, Ordered Product Sales, and Sessions still add up correctly across marketplaces: more marketplaces just means more real activity in the total.
Rate and ratio metrics work differently. Averaging a percentage or rate across marketplaces with different pricing, traffic, or Buy Box dynamics produces a number that doesn't reflect any single marketplace's actual performance. These fields need to be scoped to one marketplace to read correctly:
- Featured Offer (Buy Box) Percentage (and its B2B variant)
- Order Item Session Percentage
- Unit Session Percentage
- Average Offer Count
- Average Selling Price
- Average Sales per Order Item
- Average Units per Order Item
- Session Percentage, Page Views Percentage, and their Browser, Mobile App, and B2B variants (available on the Sales and Traffic by Child ASIN report)
- Refund Rate and Refund Rate B2B (Sales and Traffic by Child ASIN report)
To scope a report to a single marketplace:
- Data Studio: add the Marketplace dimension to your table and apply a Marketplace filter, or add a Sales Channel filter control.
- Google Sheets and Microsoft Excel: add Marketplace as a dimension in your query and create a Marketplace filter.
If your account covers more than one marketplace, build one report per marketplace (or filter to one marketplace at a time) rather than reading a single blended report, especially for any of the rate or ratio fields above.
Note: In one case, an account's Ordered Product Sales, Units Ordered, and Sessions all matched Amazon's own reporting, while Featured Offer (Buy Box) Percentage read about 24 to 25 percent against Amazon's reported 97 to 99 percent for the same window. That pattern (volume metrics matching while one rate metric doesn't) is consistent with an unscoped, multi-marketplace pull; treat it as a signal to check your Marketplace scoping first. For a deeper walkthrough with worked examples, see Why Does My Amazon Seller Central Buy Box Percentage Not Match Amazon While Other Metrics Do?
Unavailable Data
- Excess inventory unavailable in EU
- Amazon Vendor Central data
- Product reviews
- Reporting by the brand field for sales and inventory
- Brand Analytics reports are not available
- Realtime data
- Custom fields
Sales and Traffic Reporting by ASIN
Power My Analytics supports two Sales and Traffic by ASIN reporting modes from Amazon Seller Central, each suited to a different use case.
Sales and Traffic by ASIN (live, parent-level)
This report fetches data on demand directly from Amazon's Selling Partner API every time a chart or table is rendered. Amazon limits this report at the seller account level (one request per 15 minutes), so seller accounts with multiple connected marketplaces will frequently see "We were unable to get live data for this component" in Data Studio, Data Builder, Google Sheets, Microsoft Excel, and other PMA destinations. See Error: 'Unable to get live data for this component' in Amazon Seller Sales and Traffic by ASIN Report for more on this rate-limit behavior. This report cannot be dimensioned by date (an Amazon limitation).
Your Sales and Traffic table's daily Data Sync and any Sales and Traffic backfill use the same Amazon allowance, because they request the same Amazon report for your seller account. While a Sales and Traffic backfill is running (a 2-year backfill makes five requests per marketplace), this live report is more likely to show the error.
Sales and Traffic by Child ASIN (cached counterpart)
For most ASIN-level reporting needs, the Sales and Traffic by Child ASIN report is the recommended choice. PMA pulls daily data from Amazon and stores it in our data warehouse, which means:
- Date dimensioning is supported. You can break out metrics by day across any date range.
- ASINs with traffic but no sales are included. Sessions and pageview activity is captured even on days when no orders ship.
- The Amazon SP-API rate limit does not affect your reports, because each render reads from PMA's cache rather than calling Amazon live.
- Two years of history from your first connection. Power My Analytics loads up to 2 years when you connect your account and keeps it current with the daily Data Sync. This table can't be backfilled from the Hub later.
Available dimensions: Parent ASIN, Title, Marketplace, Inventory SKU, start date, end date.
Available sales metrics: Units Ordered, Units Ordered B2B, Ordered Product Sales, Ordered Product Sales B2B, Units Shipped, Units Shipped B2B, Orders Shipped, Orders Shipped B2B, Shipped Product Sales, Shipped Product Sales B2B, Units Refunded, Units Refunded B2B, Refund Rate, Refund Rate B2B.
Available traffic metrics: Sessions, Sessions B2B, Page Views, Page Views B2B, Browser Sessions, Browser Sessions B2B, Browser Page Views, Browser Page Views B2B, Mobile App Sessions, Mobile App Sessions B2B, Mobile App Page Views, Mobile App Page Views B2B, Featured Offer (Buy Box) Percentage, Featured Offer (Buy Box) Percentage B2B, Traffic Featured Offer Page Views, Traffic Featured Offer Page Views B2b.
Summing metrics across days
Four metrics can be safely summed across daily rows for multi-day reports: Units Ordered, Ordered Product Sales, Total Order Items, and Traffic Featured Offer Page Views. Other sales and traffic metrics behave as point-in-time or aggregate-only values and should not be totaled across rows without verification. Use Featured Offer (Buy Box) Percentage as-is rather than summing or averaging it; Power My Analytics calculates it from the summed page views.
Percentage fields (Session Percentage, Page Views Percentage, and Browser/Mobile App/B2B variants)
Percentage fields can only be calculated correctly at aggregate; they cannot be summed across rows. Where you configure them depends on the destination:
Google Sheets and Microsoft Excel: Percentage fields are precomputed by PMA and selectable directly from the schema. Look for fields like Total Session Browser Percentage, Total Session Mobile App Percentage, and their B2B variants.
Data Studio: Percentage fields are hidden from the data source by default. The PMA Data Studio demo template includes them preconfigured, so most users can simply start from that template. To add a percentage column to a custom report:
- Add the underlying total field (for example, Session Total) to your table.
- Add the same field a second time.
- Edit the second instance.
- Under Comparison calculation, select Percent of total.
- Rename the field to match the Amazon UI label (for example, Session Total Percentage).
The same approach works for Page Views Total, Session Browser, Sessions Mobile App, and their B2B variants.
A note on Data Studio filters: Percentage values computed via the Percent of total comparison calculation are derived from the unfiltered table aggregate; they will not reflect chart-level filters. This mirrors how percentages behave in Amazon's own UI. If you need filter-responsive percentages, rely on the precomputed Google Sheets fields instead.
Date partition support for exports
When a date column is included in the report request, exports to BigQuery, SQL, FTP, and other destinations honor the daily partition. If no date column is requested, the export returns aggregated values across the requested range.
How to Blend Amazon Data with Other Data
Report Sales by Brand
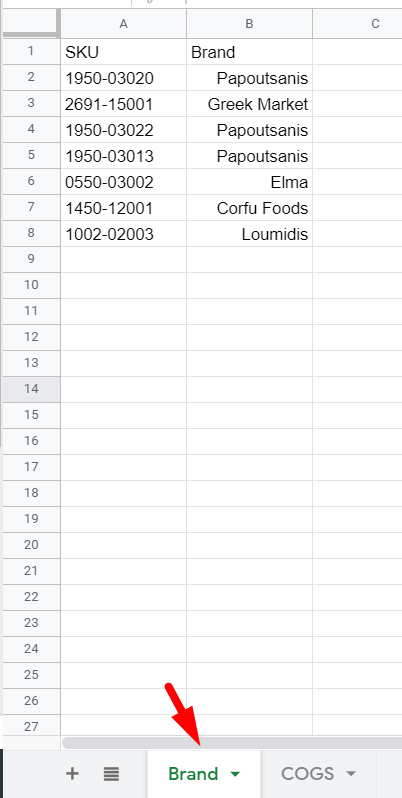
To overcome this limitation in Amazon's API, create a Google Sheet with two columns.
- SKU
- Brand
Then blend this data with your Data Studio report. See this Google Sheet with example data in the "Brand" tab:
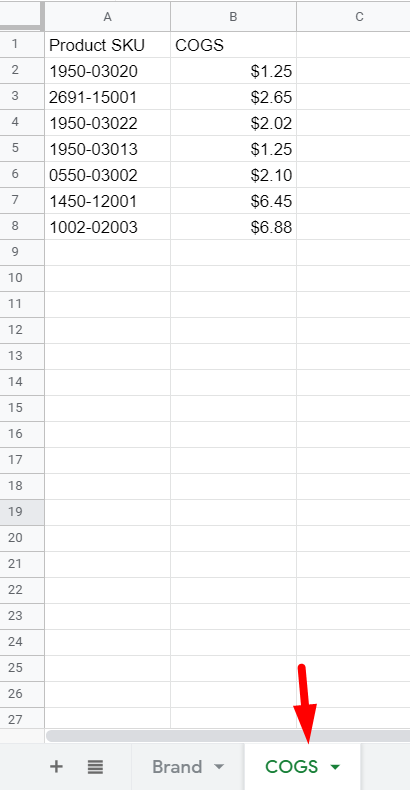
COGS reporting
To include the product cost of goods sold, create a Google Sheet with this data:
SKU
COGS
Note: COGS data from Amazon Seller must be manually exported from your suppliers and imported into Google Sheets.
See this Google Sheet with example data in the "COGS" tab:
Report Amazon Ads Data with Amazon Sales Data
To join Amazon Ads data with sales data:
- Export your Amazon Ads data into a Google Sheet
- Either join that data in Google Sheets/Microsoft Excel, or create a data source in Data Studio using the Google Sheets connector
- Use the Blending feature in Data Studio when you need both Ads and Sales data in the same report
Google offers a support article on the subject if you require a more detailed walk-through.
Troubleshooting
Please see our Troubleshooting Amazon Seller article for information on issues that may affect the Amazon Seller connector.