
Data Studio: Grand Total Over a Date Range is Less Than Sum of Individual Rows Broken Out By Date
Last updated
This page will assist you with the following issue:
When reporting individual values by date in Data Studio, the sum of these individual values over a date range may be less than the grand total of the values over the same date range.
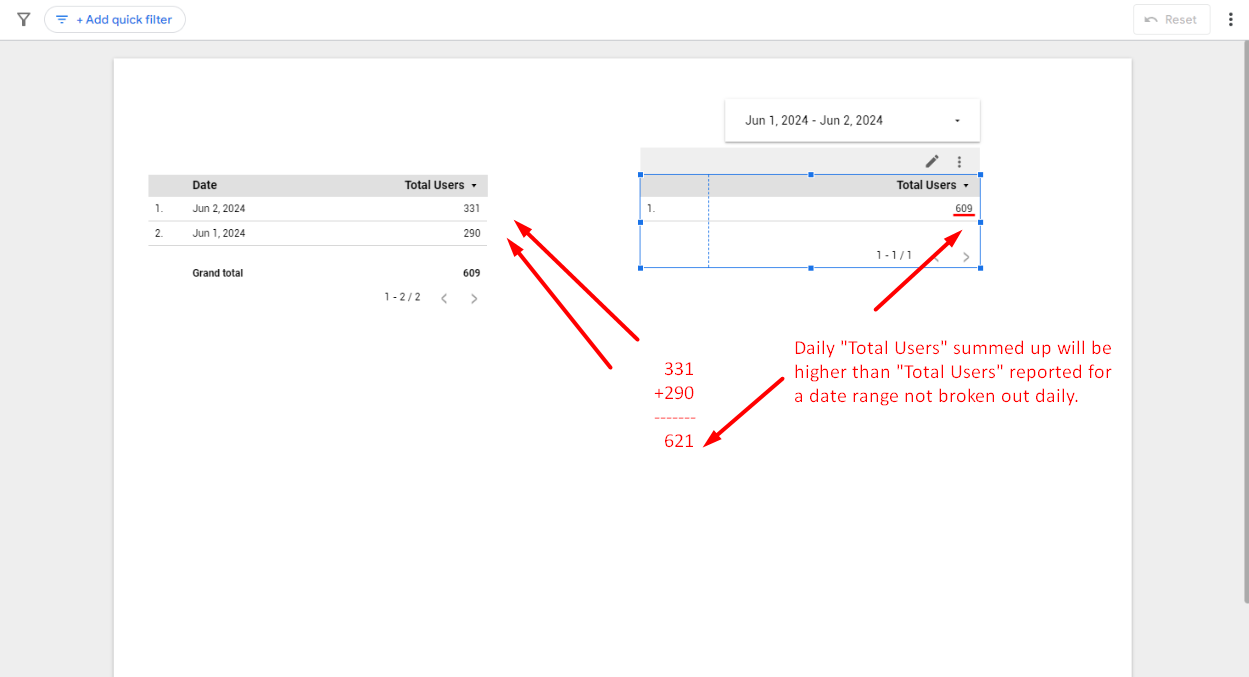
For example, this Google Analytics 4 (GA4) report of Total Users by Date over June 1 - 2, 2024 shows values of 331 and 290, summing to 621 Total Users.
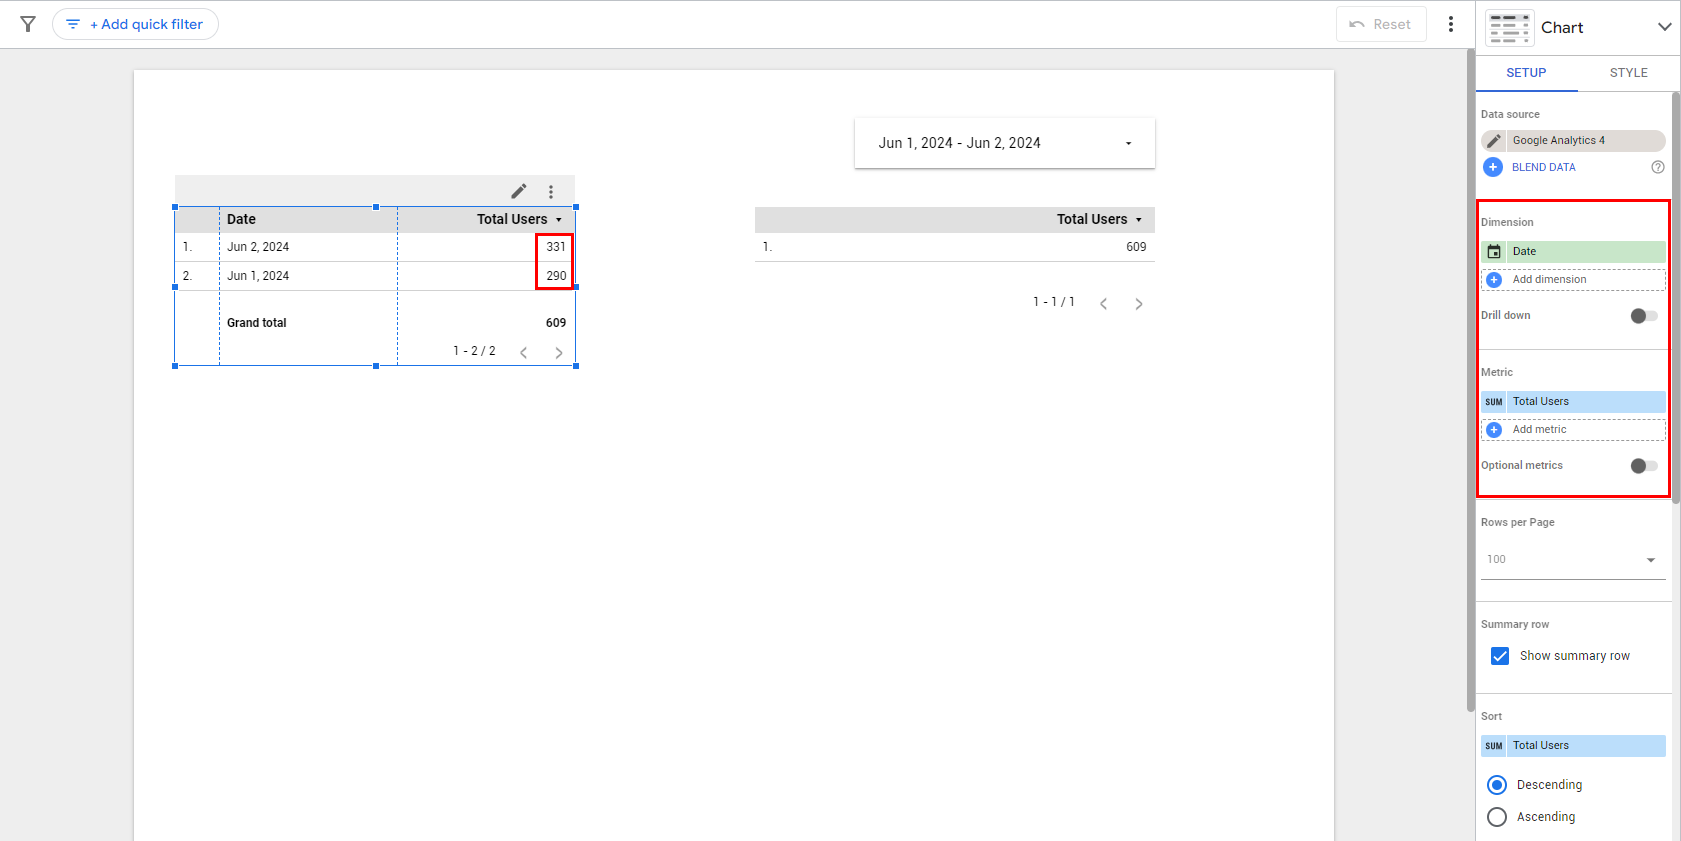
However, the grand total shown is only 609.
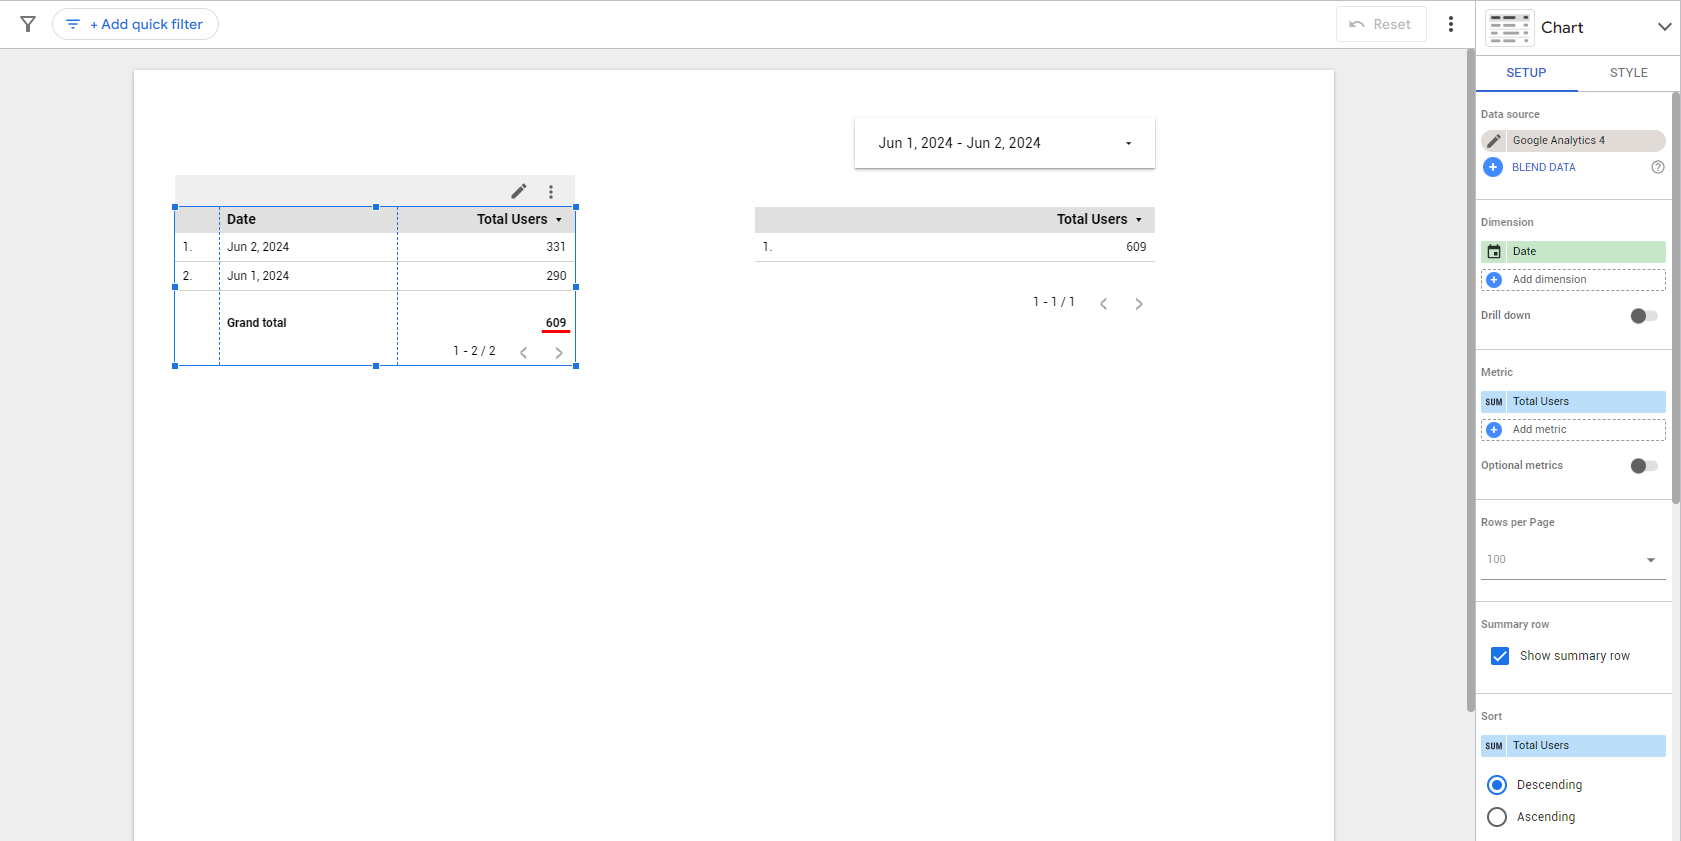
Similarly, using a date control that spans June 1 - 2, 2024 while reporting Total Users without any dimensions will produce a value of 609.
Cause
Both the daily values and the grand total are correct. The grand total is a unique count over the date range.
- In this example, because the summed rows showed 621 total users and the grand total showed only 609 over the date range, this is a difference of 12 users. This means 12 users were present on both June 1 and June 2, 2024.
- A sum of total users by day (equalling 621) would result in these users being counted twice, once for each day, while the grand total is the de-duplicated value (609).
The following is a partial list of fields whose daily values will not sum up to the grand total over a multi-day range. The sum of the daily row values for these fields will exceed the grand total:
| Data source | Affected fields |
|---|---|
| Facebook Ads | Reach, Frequency |
| Google Analytics 4 | All fields containing "User" (Active Users, Active1day Users, Active7day Users, Active28day Users, Total Users) except for New Users |
| LinkedIn Ads | Reach, Average Frequency |
| Pinterest Ads | Reach, Frequency |
| Snapchat Ads | Earned Reach, Paid Reach, Total Reach, Frequency |
| TikTok Ads | Reach |