
X Analytics (Twitter) Data Connector User Guide
Last updated
Note: X Analytics (formerly Twitter Analytics) is a powerful data source that provides valuable insights into your X account's performance, audience engagement, and tweet activity. This guide will walk you through the process of setting up X Analytics as a data source in Power My Analytics, creating reports, and understanding key metrics and limitations.
Prerequisites
- An X Ads account is required to connect your X Analytics account to Power My Analytics
- Your account with X Ads must have an active X Premium subscription (blue checkmark)
To create an X Ads account:
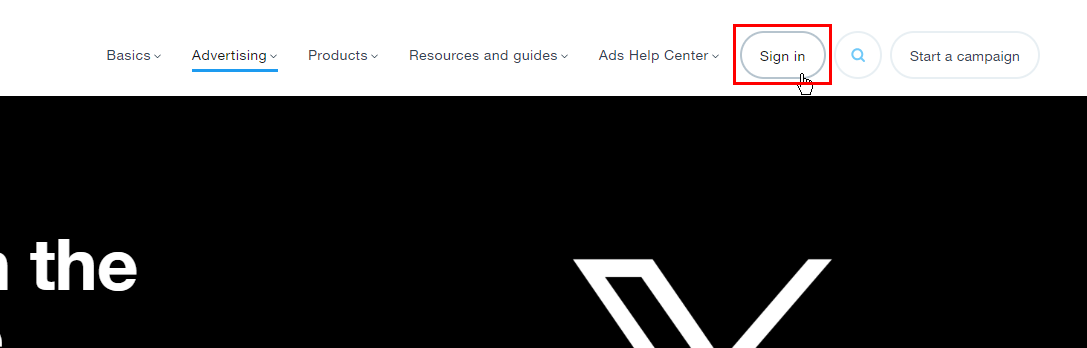
Go to ads.x.com and click Sign in.
Log in to your X account.
Note: Individual tweet data will only be accessible starting from the date your ad account was created.
Adding X Analytics as a Data Source
Make sure you are logged in to the X account you want to connect as a data source.
Navigate to your Hub and select Sources from the menu.
Click + Add new source and choose X Analytics from the gallery.
Sign in to your X account to authenticate and authorize Power My Analytics to access your account.
- If the X authorization popup shows an X account other than the one you want to connect, log out of that account and log into the X account you're trying to connect.
Creating a Data Studio Report
Follow these steps to create a Data Studio report using your X Analytics data:
After adding X Analytics as a data source in the PMA hub, navigate to Reports > Data Studio
Select X Analytics under Create Data Studio Report (this will open the official Data Studio application in a new window)
Google Data Studio Configuration:
Step 1:
- Name your data source (e.g., "X Analytics - Organization Name")
- Choose your Power My Analytics hub from the dropdown
- Optional: Leave "Use report template for new reports" checked to use the PMA demo template
- Click Next
Step 2:
- User Account: Select your X Analytics account (real data) or "Sample Account" (sample data)
- Click Next
Step 3:
- Click Connect (top right) to complete the data source configuration
Step 4:
- Click Create Report (top right)
- Include "today" in your report's date range to begin historical data storage
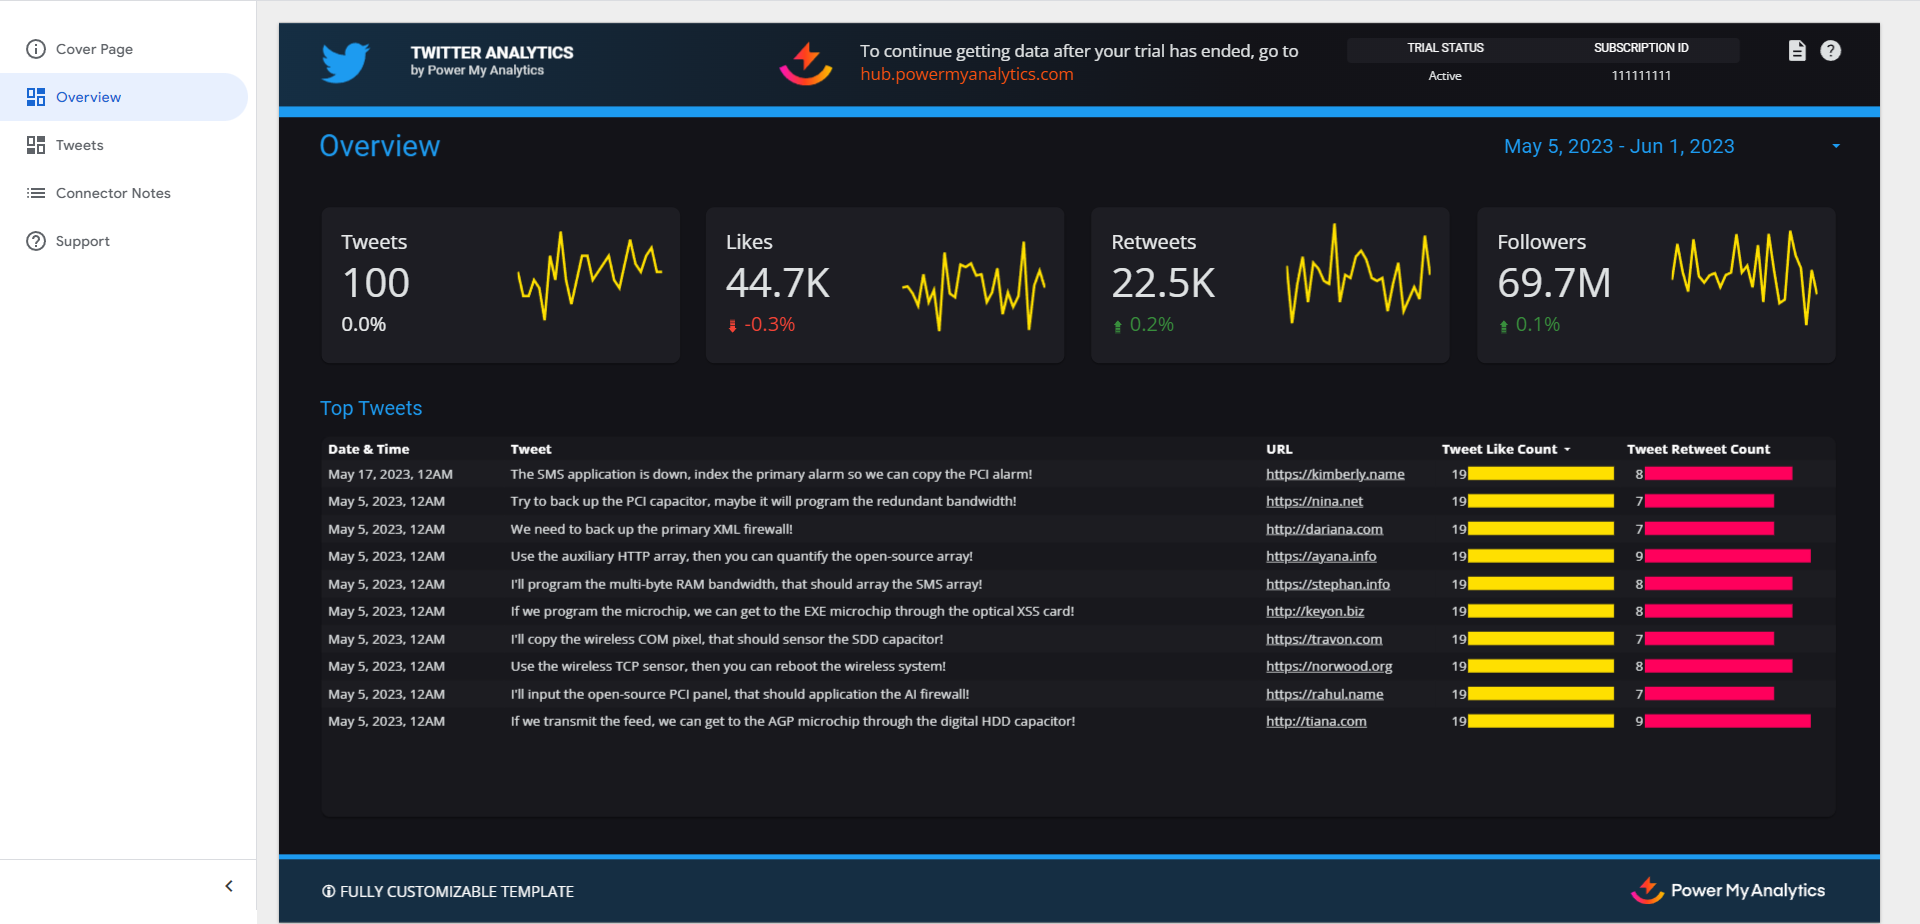
For a quick start, use our pre-built X Analytics demo template.
Key Reports and Fields
Here are some popular X Analytics metrics you can use in your reports:
- Account metrics (lifetime totals): Followers Count, Friends Count (accounts you follow), Statuses Count (posts), Listed Count, User Favourites Count (posts the account has liked)
- Post metrics (Tweets table, running total per post): Tweet Like Count, Tweet Retweet Count
- Organic post metrics (Tweets Organic table, per post per day): Impressions, Engagements, Clicks, Link Clicks, Likes, Reposts, Replies, Follows, Unfollows, Card Engagements, Poll Votes
- Organic video metrics (Tweets Organic table, per post per day): Video Views, Video Starts, Video Played 25%, Video Played 50%, Video Played 75%, Video Completions, 3s/100% Video Views
For a complete list of available X Analytics fields in Power My Analytics, refer to the Schema Explorer.
Limitations and Important Considerations
Cached Data Requests with Unique Metrics and Date Dimension: When a unique metric is paired with the date dimension, this will result in a request for cached data instead of a request for live data. For more information, please see Understanding Cached and Live Data Requests.
Backfilling: An initial backfill of 24 months of data will be performed when you first connect your X Analytics account as a data source. The Tweets Organic metrics load up to one year (see Organic post metrics below).
Lifetime metrics: The account-level fields Followers, Following, Likes (posts the account has liked), Tweets, and Lists are lifetime values and cannot be backfilled.
Ad account creation date: Individual tweet data is only available starting from the date your X Ads account was created.
Organic post metrics: The Tweets Organic metrics are collected every day for each post during its first 90 days after it's published. Each row is one post on one day, dated in your X Ads account's time zone; a day on which a post had no activity has no row. When you first connect X Analytics, this table loads up to one year of history. To load older dates for a source you connected earlier, run a manual backfill from your Hub.
Organic activity only: The Tweets Organic metrics count organic activity. If you also promoted a post, its paid impressions and engagements are in the X Ads (Twitter) connector.
Daily counts and running totals: Likes, Reposts, and Replies count the activity a post received each day. Tweet Like Count and Tweet Retweet Count are each post's running totals, dated by the day the post was published, so a date range selects the posts published in that range rather than the activity that happened in it. To report likes or reposts received within a date range, use Likes and Reposts.
Link Clicks: Link Clicks matches the link clicks figure in X Analytics. X doesn't provide URL clicks for organic posts.
Rate metrics: Engagement rate and other rates aren't available as fields. You can create them in Data Studio as calculated fields, for example
SUM(Engagements) / SUM(Impressions).
Unavailable Data
- URL clicks for organic posts (use Link Clicks)
- Bookmarks, shares, and video watch time
- Separate counts of profile clicks, hashtag clicks, and detail expands (these are included in Clicks)
- Reply Count and Quote Count (X doesn't return these counts to Power My Analytics; for replies, use Replies)
- Realtime data
- Custom fields
Troubleshooting
See our article Basic Troubleshooting for information on issues that may affect the X Analytics connector.