How to Connect a Google Sheets Report to Data Studio
Last updated
Note: In this article, we'll show you how to use Google Sheets as a data source for Data Studio. Learn all about connecting your spreadsheet, choosing field types, and integrating your data into Data Studio charts for visually engaging presentations.
Activate the Spreadsheet Addon
Using the Spreadsheet Addon
The spreadsheet addon is included in our Grow, Pro, and Custom (formerly Enterprise) plans. It enables you to use all of our connectors with Google Sheets and Excel, though only Google Sheets can be connected to Data Studio.
Create a Report in Google Sheets
The addon panel is similar to the connector configuration page in Data Studio except that you create each table individually. When creating a report to connect to Data Studio, make sure the date range matches the one you are using in your Data Studio report.
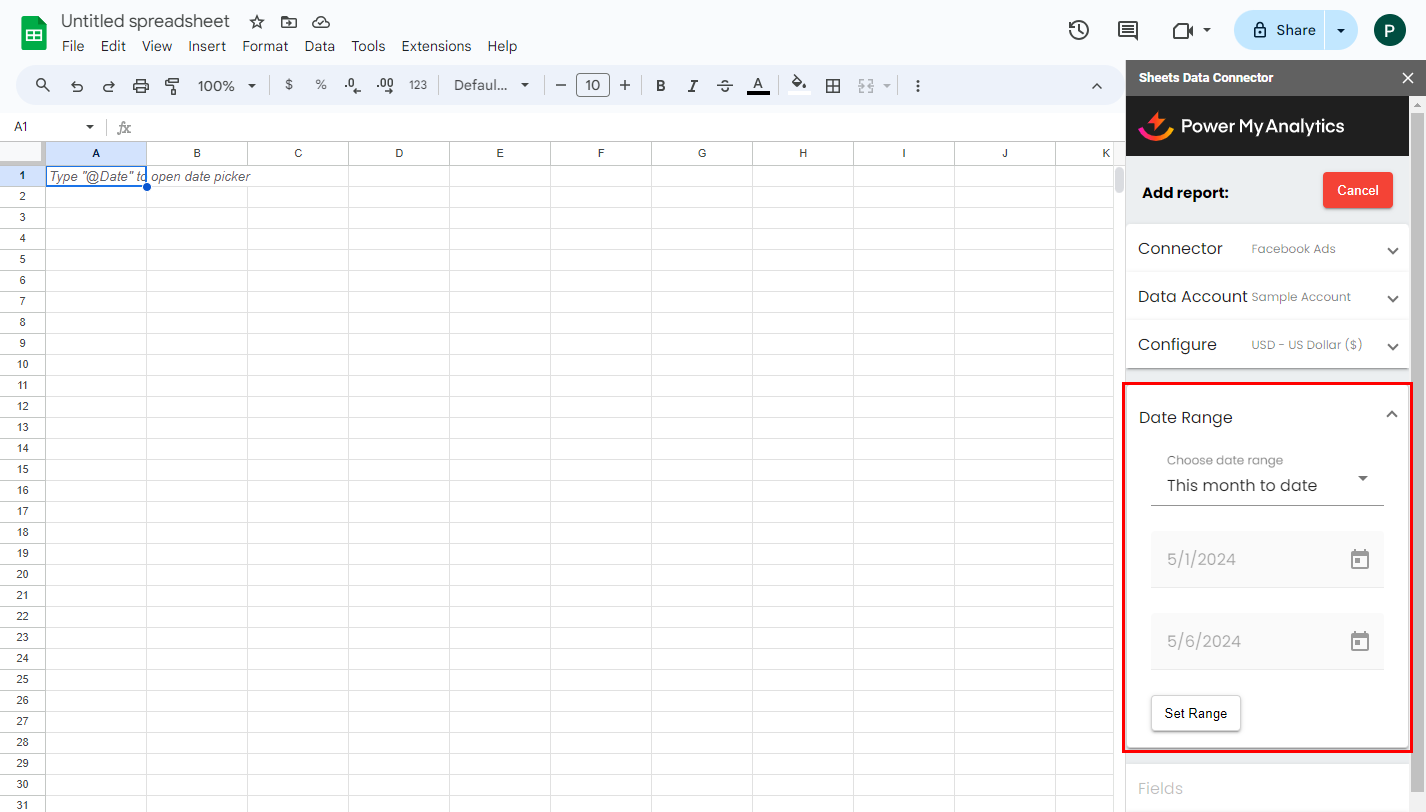
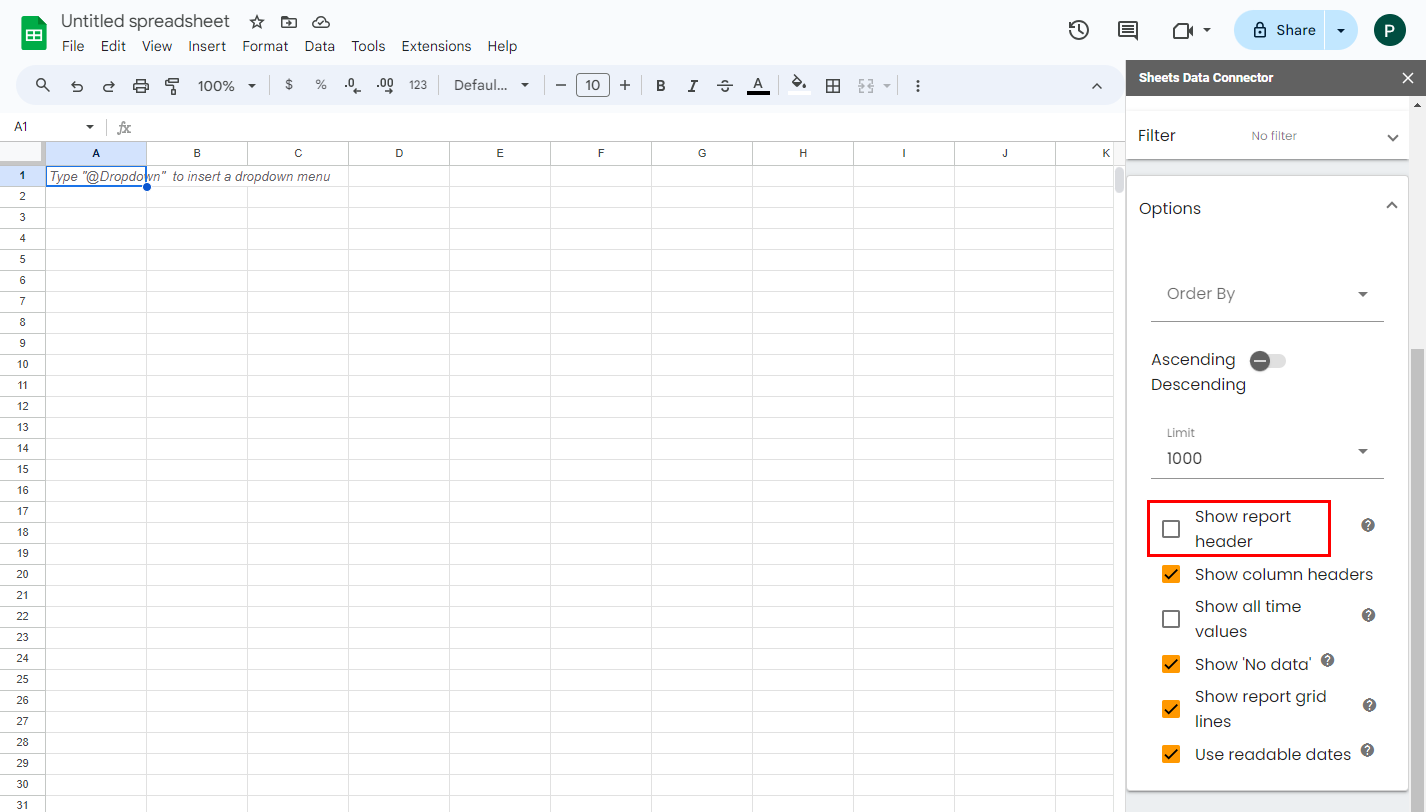
Deselect Show report header under Options.
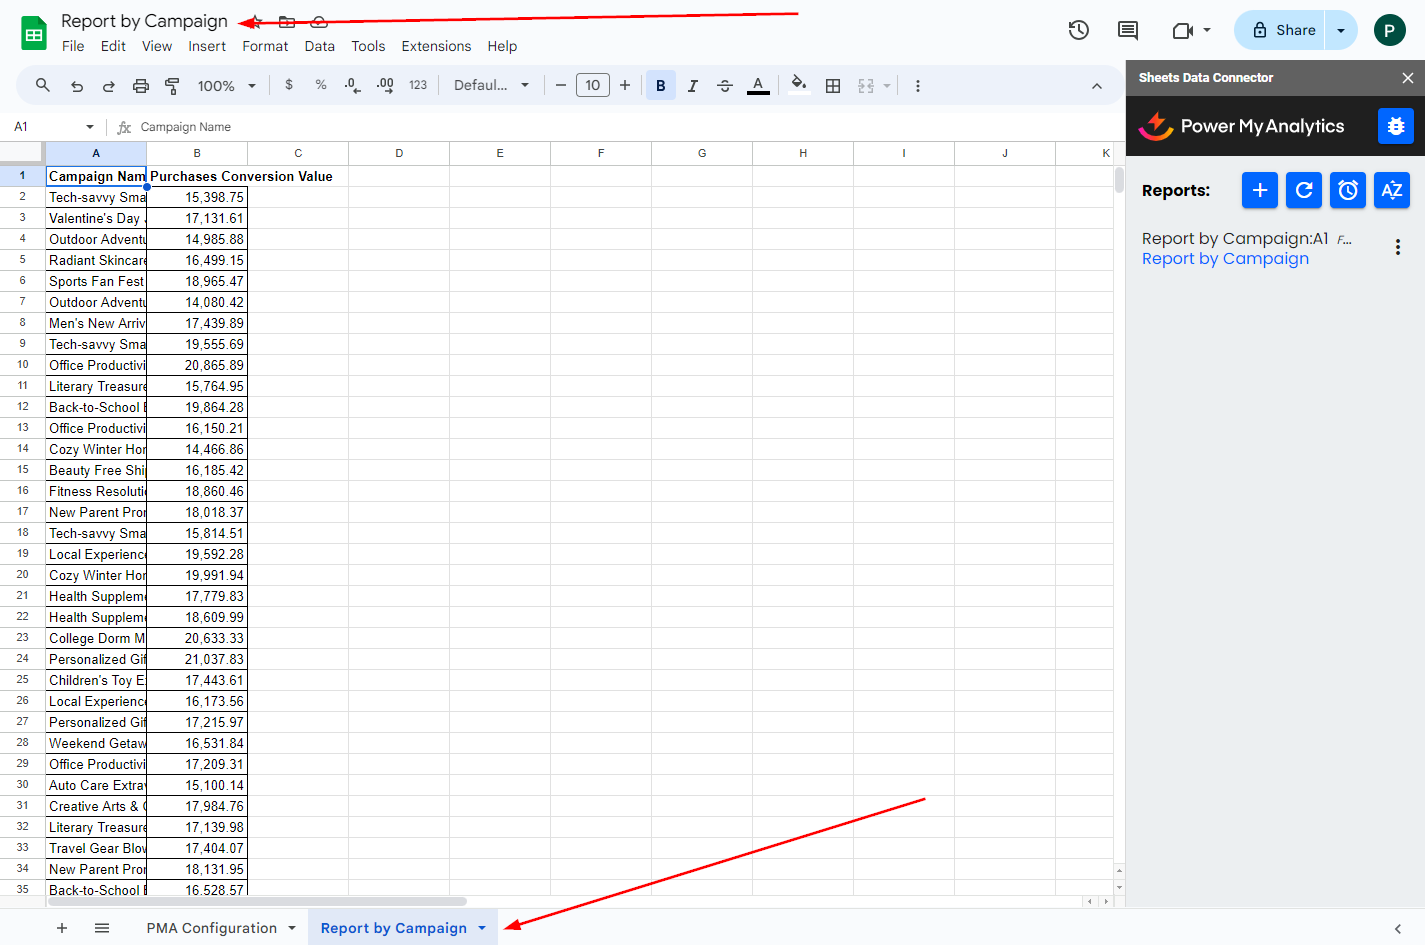
Make a note of the name of the report and the sheet you wish to connect.
Connect the Sheet to Data Studio
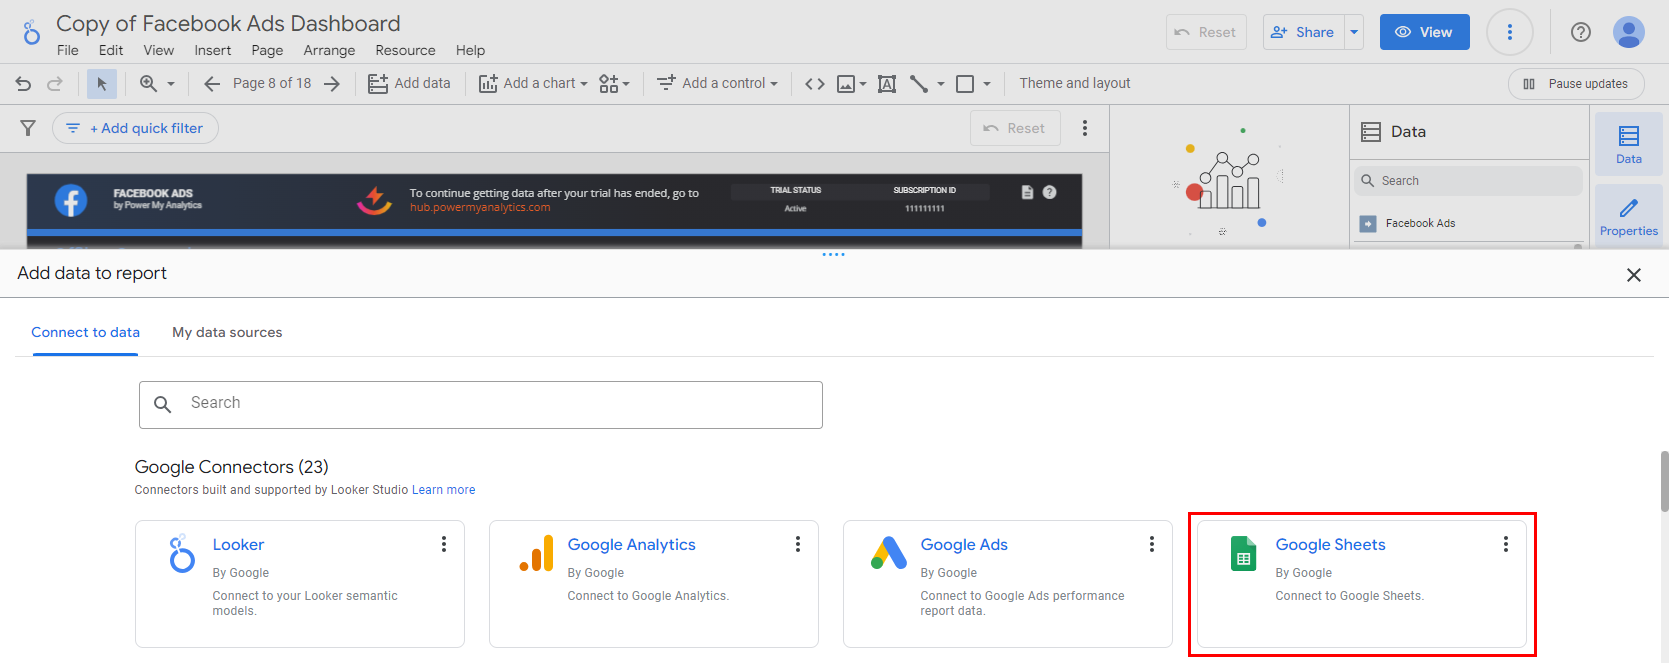
Click Add data at the top of the screen.

Select Google Sheets. This is a free connector provided by Google.
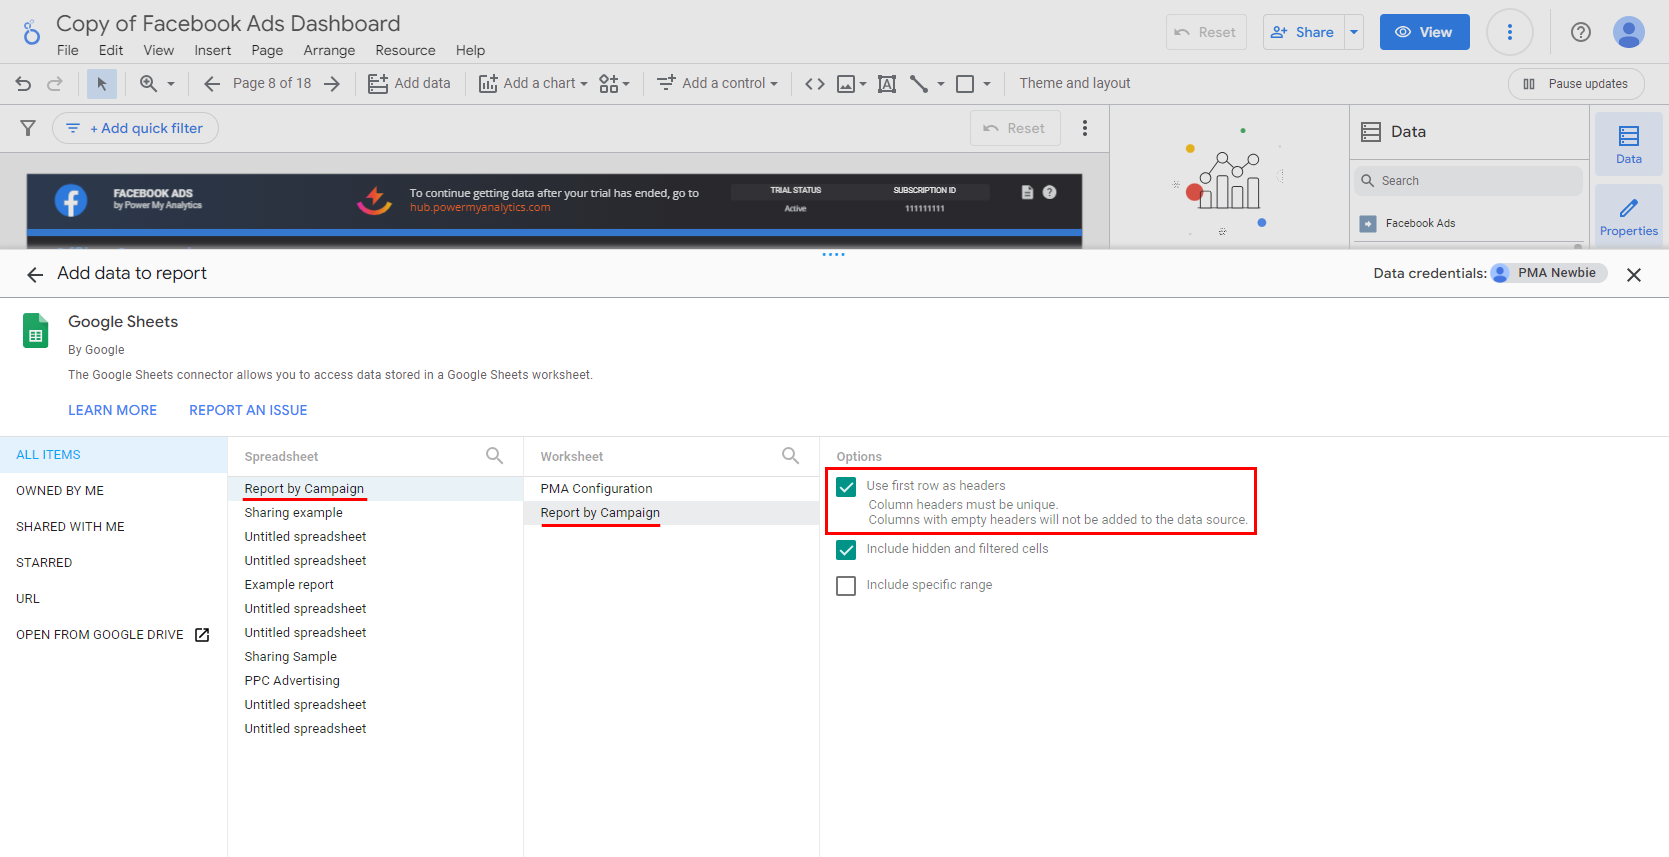
Select the report and sheet you wish to connect. Leave Use first row as headers checked.
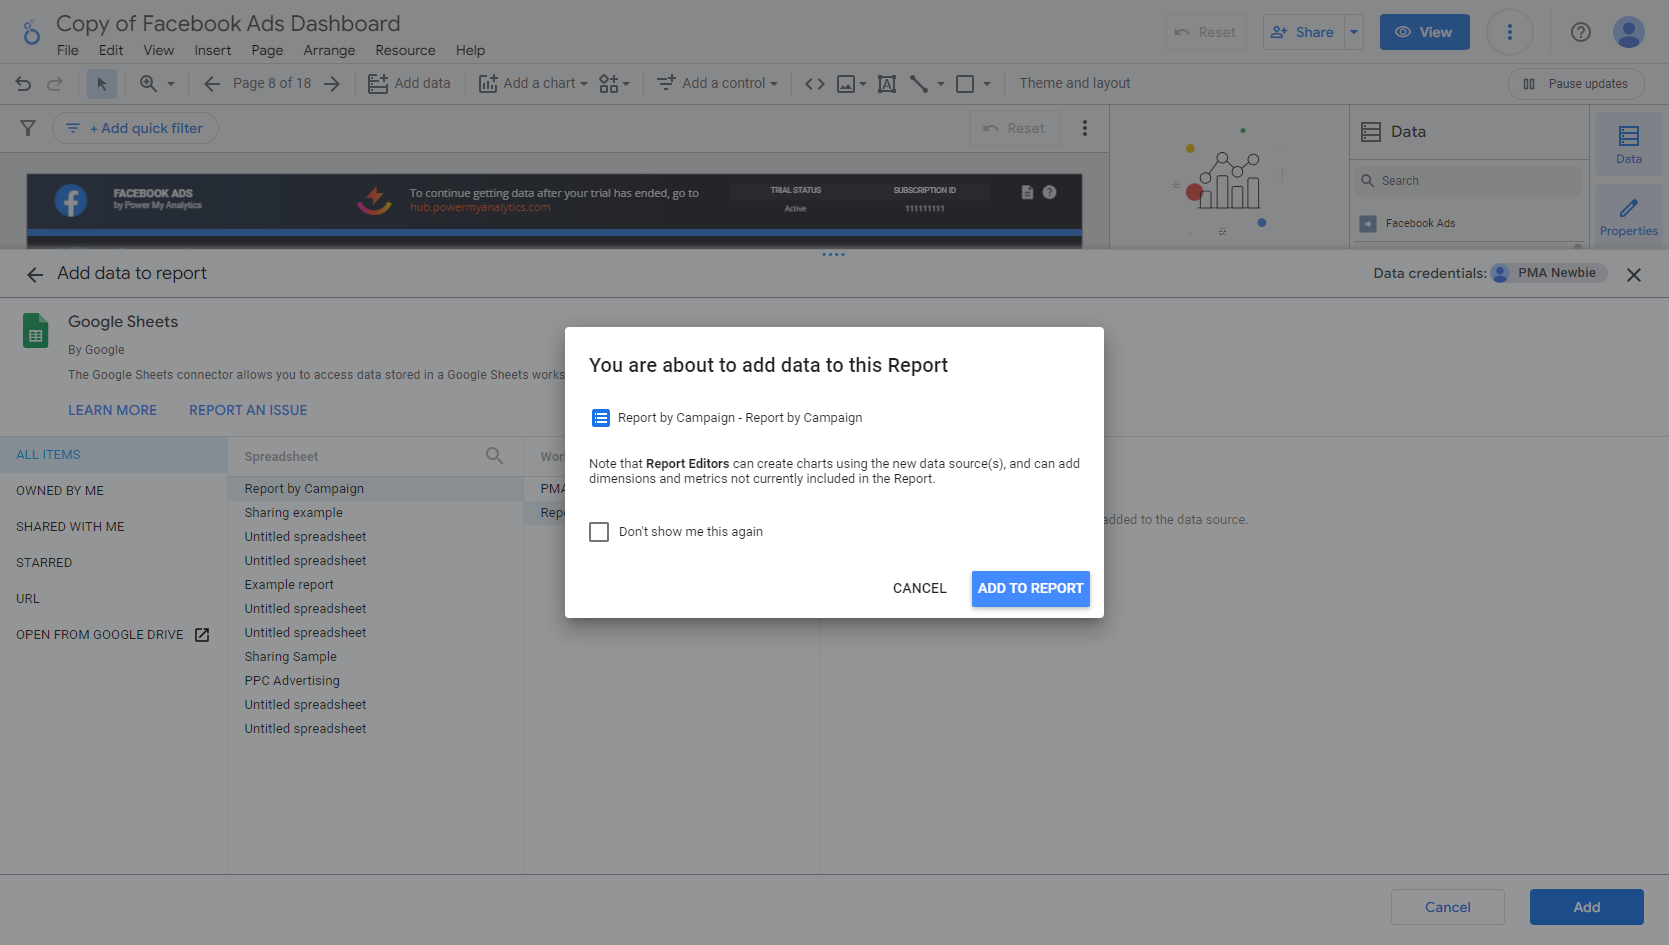
Click Add, then click Add to Report.
Verify and Edit Your Data
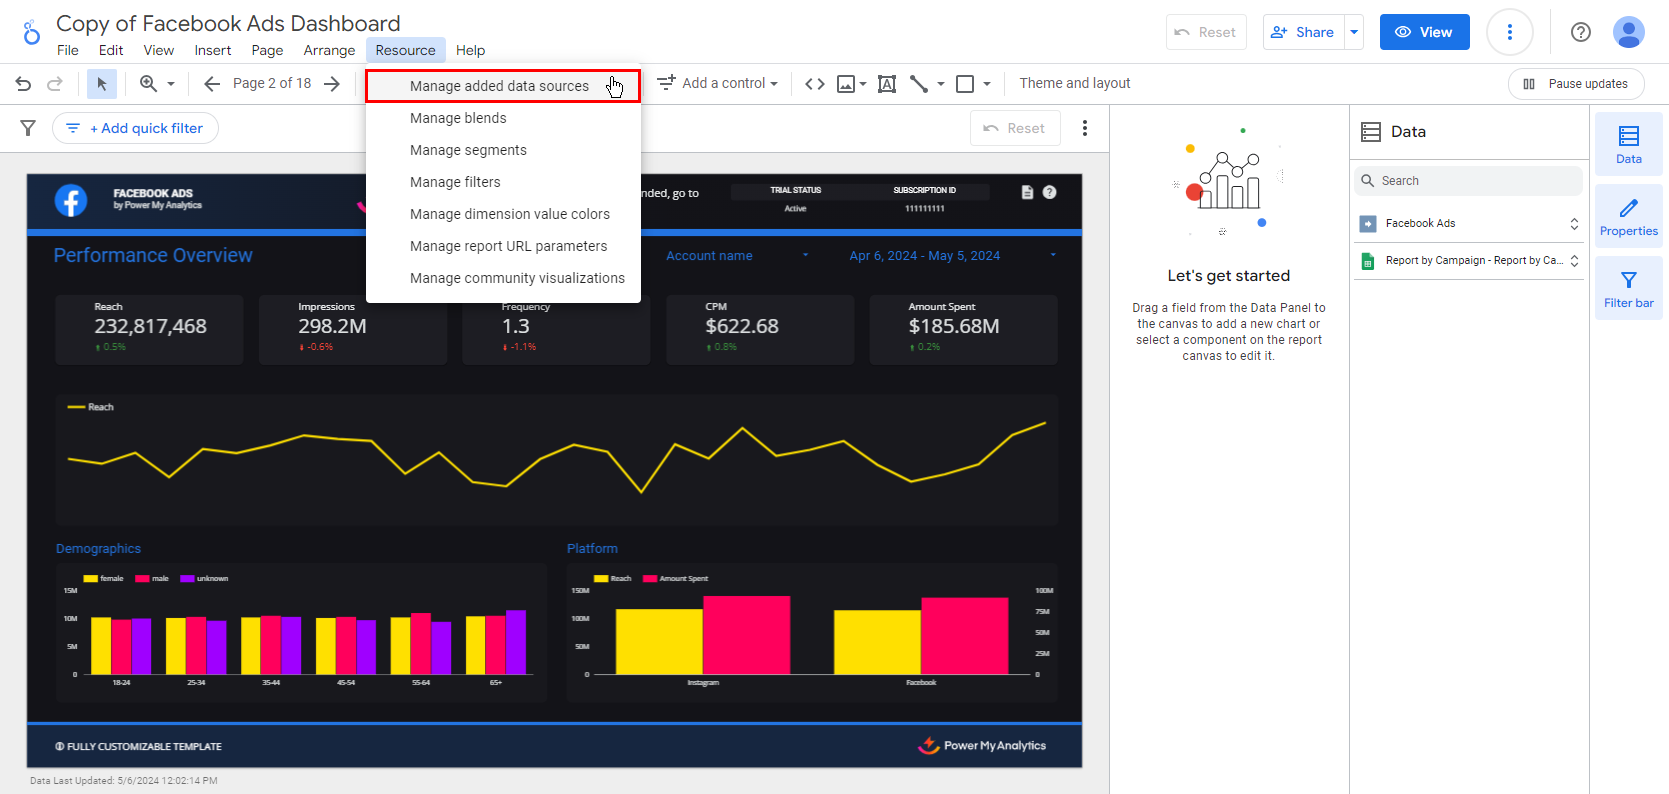
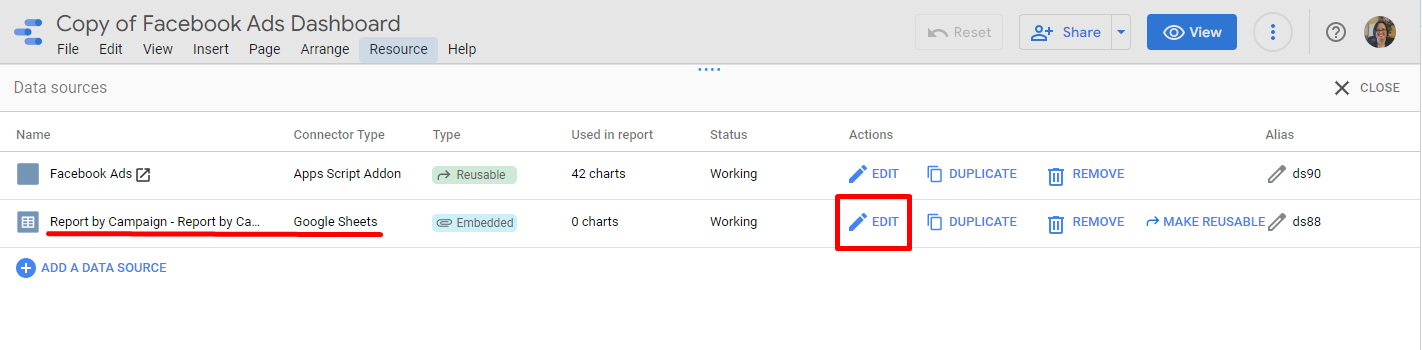
Select Manage added data sources under Resource.
Click Edit next to the spreadsheet.
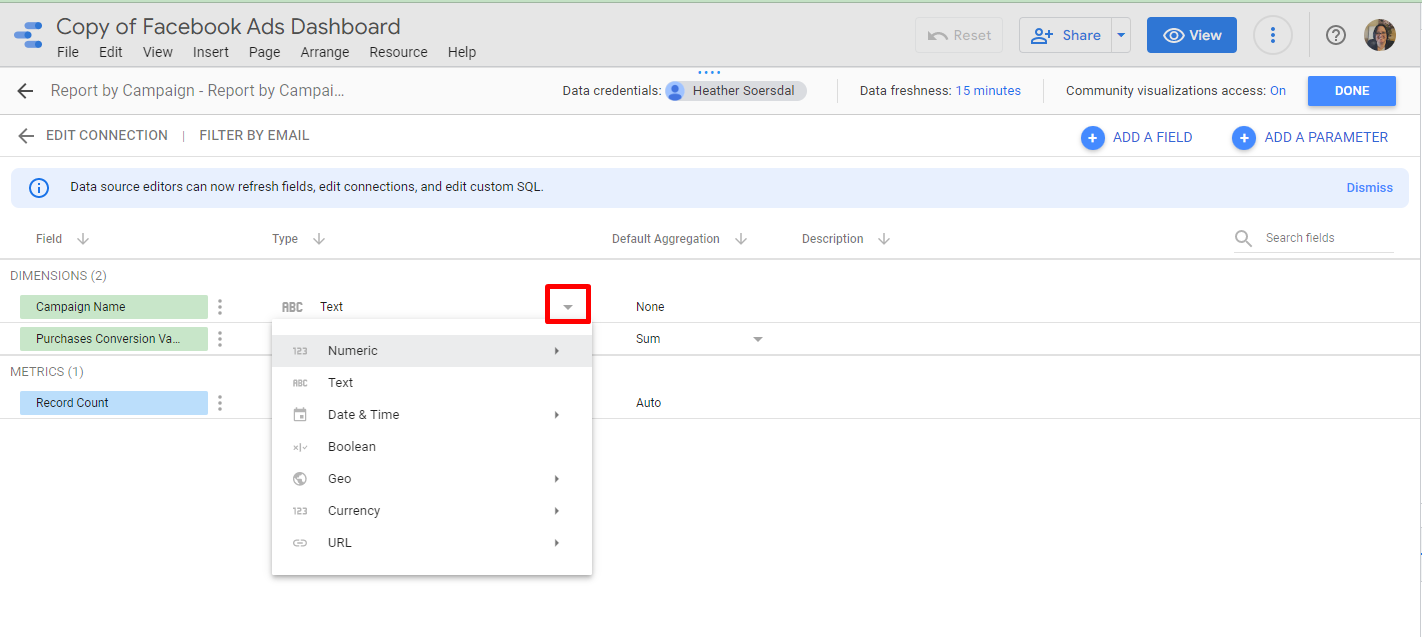
Verify each field has the correct label and type. If needed, modify the field type. Select the arrow and choose the correct type from the drop-down menu.
Use Your Sheet in Charts
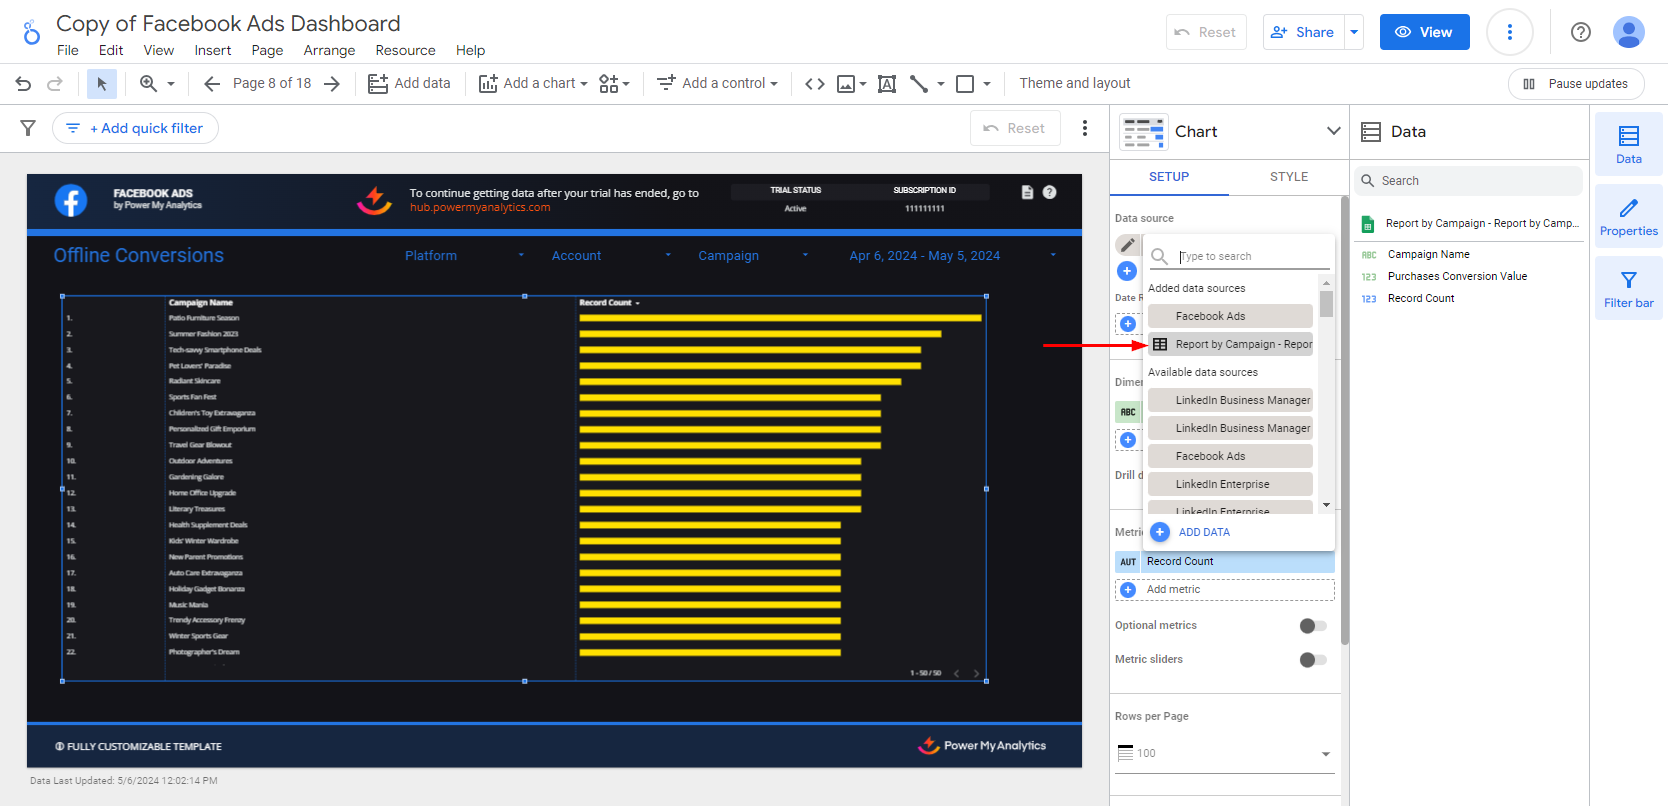
Select your spreadsheet under Data Source to use it in a chart.